
Map Gallery
Explore the Map Gallery to discover real-world use cases and maps built with GOAT. See how spatial analysis drives smart decisions in mobility, urban planning, and climate resilience.
- Energy
- Sustainability & Climate Risk
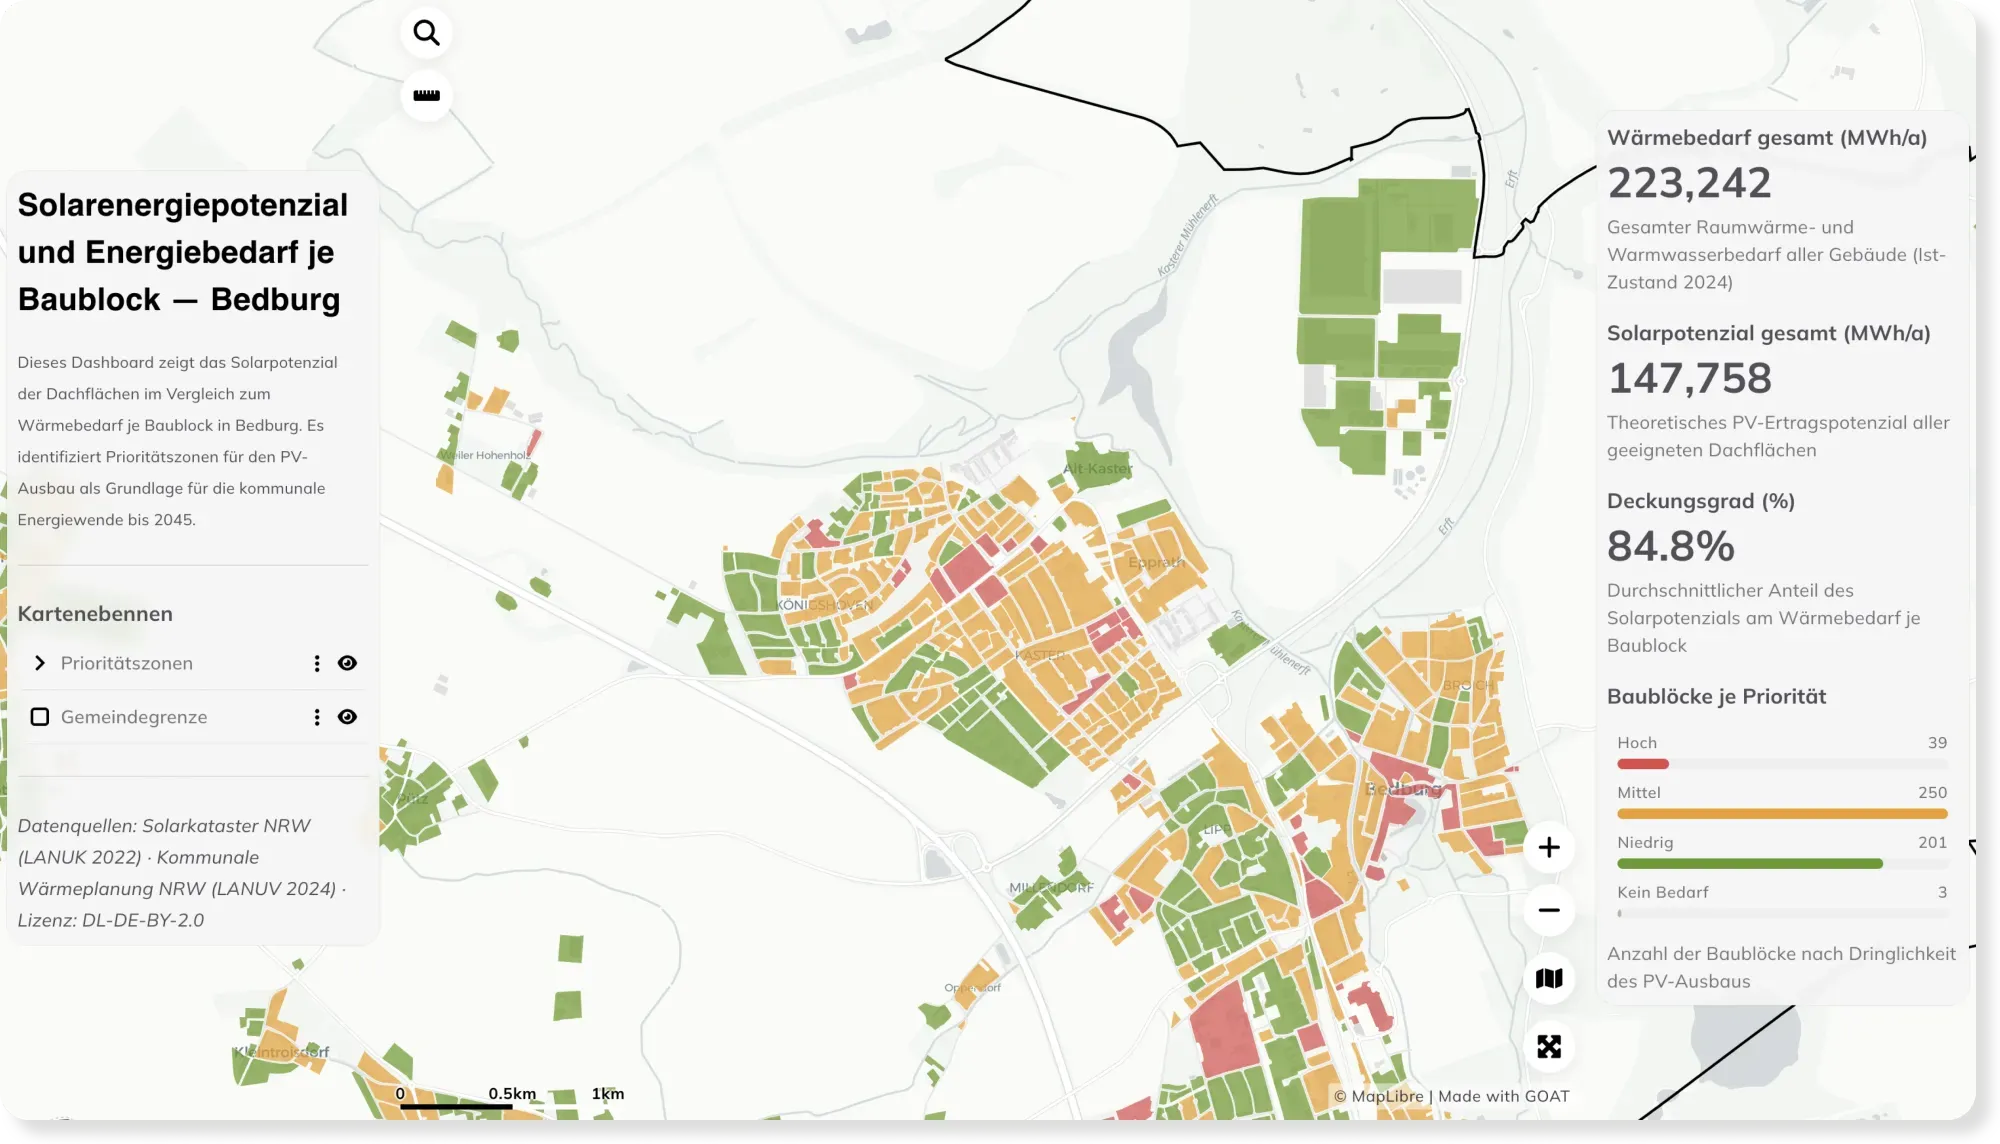
Rooftop Solar Potential vs. Energy Demand per Block — Bedburg
How much energy could a city's rooftops cover? This dashboard compares rooftop solar potential with heat demand per block in Bedburg, revealing priority zones for solar expansion.
See the map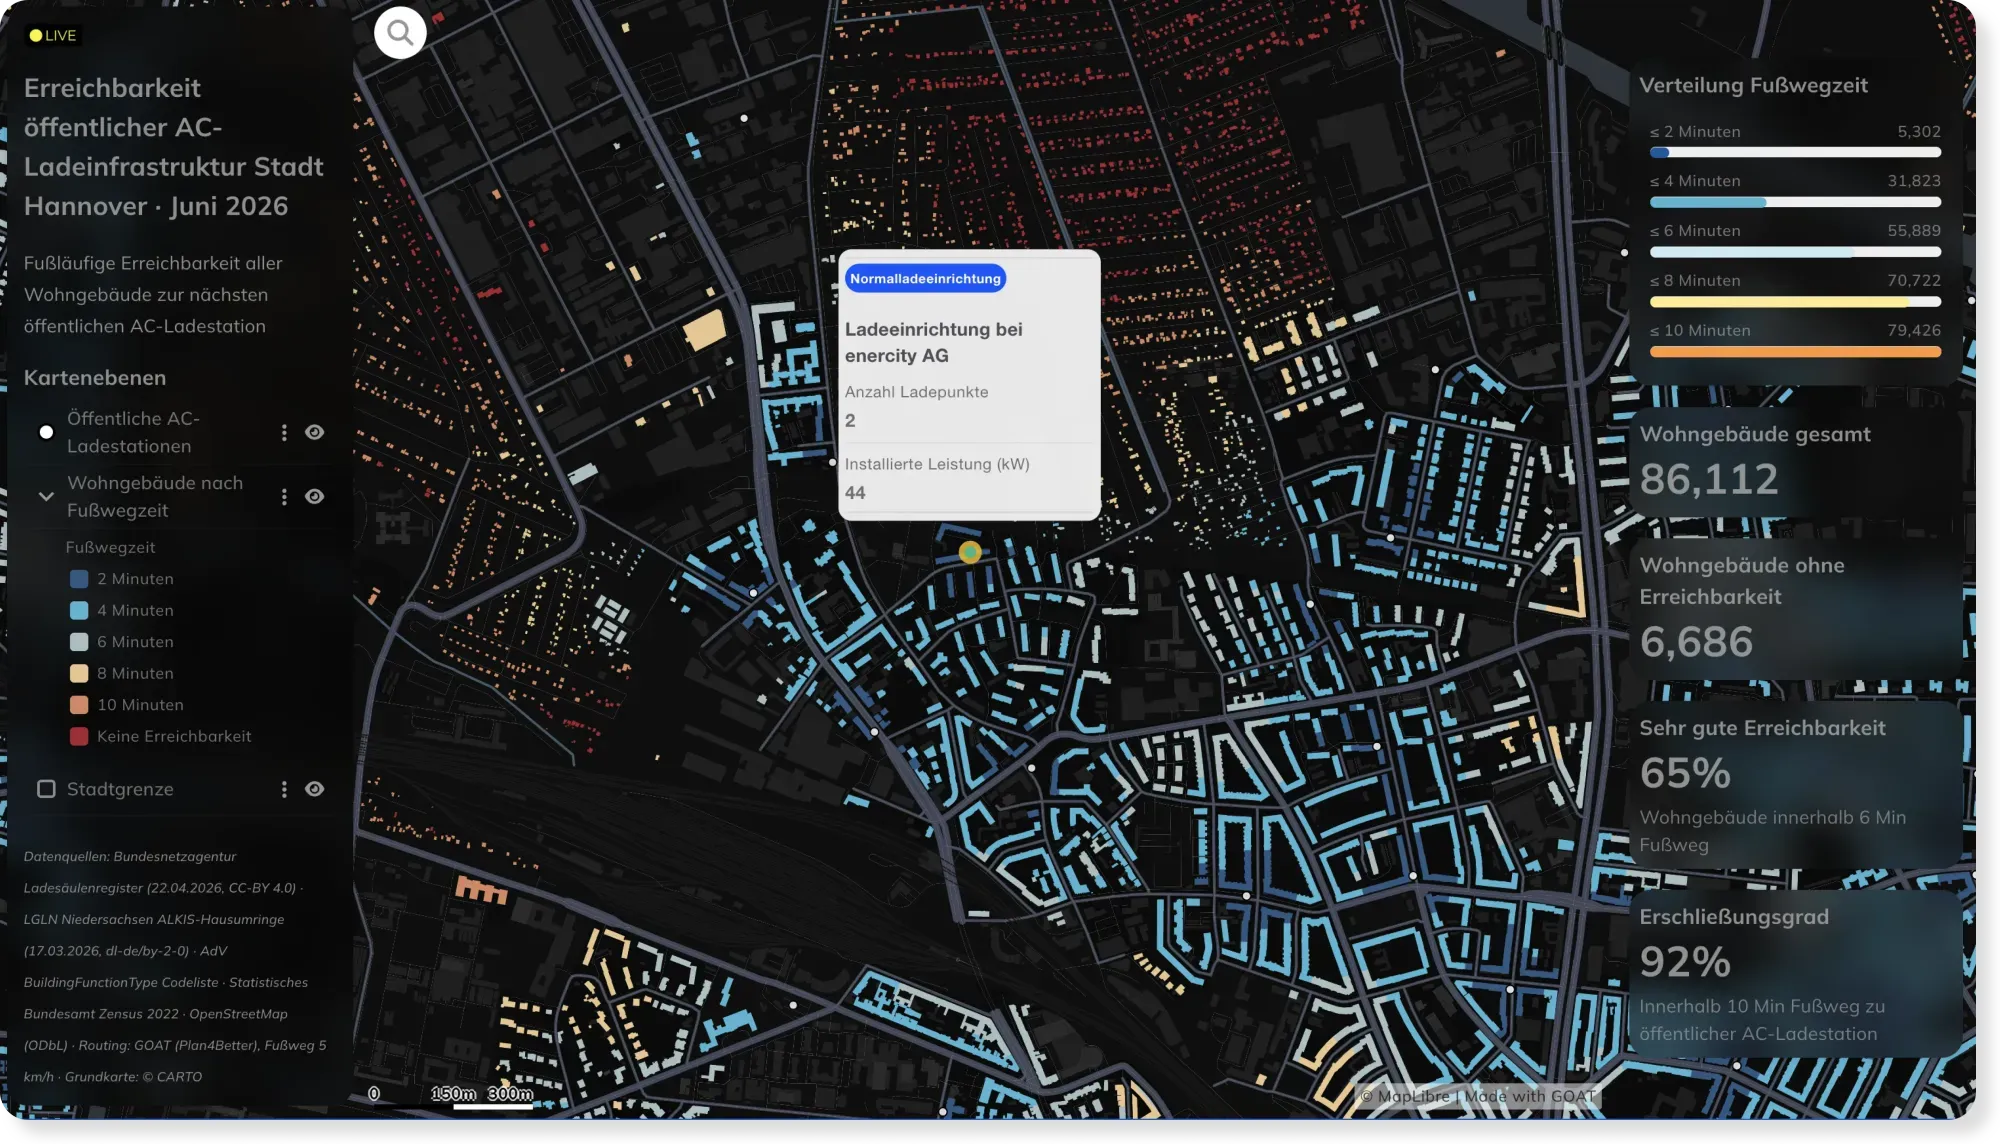
- Energy
- Mobility Planning
Live EV Charging Accessibility in Hannover, Powered by Automated Workflows
Charging networks change weekly. This Hannover dashboard stays current automatically — custom SQL and scheduled workflows recompute walking access to every AC charger as the data updates.
See the map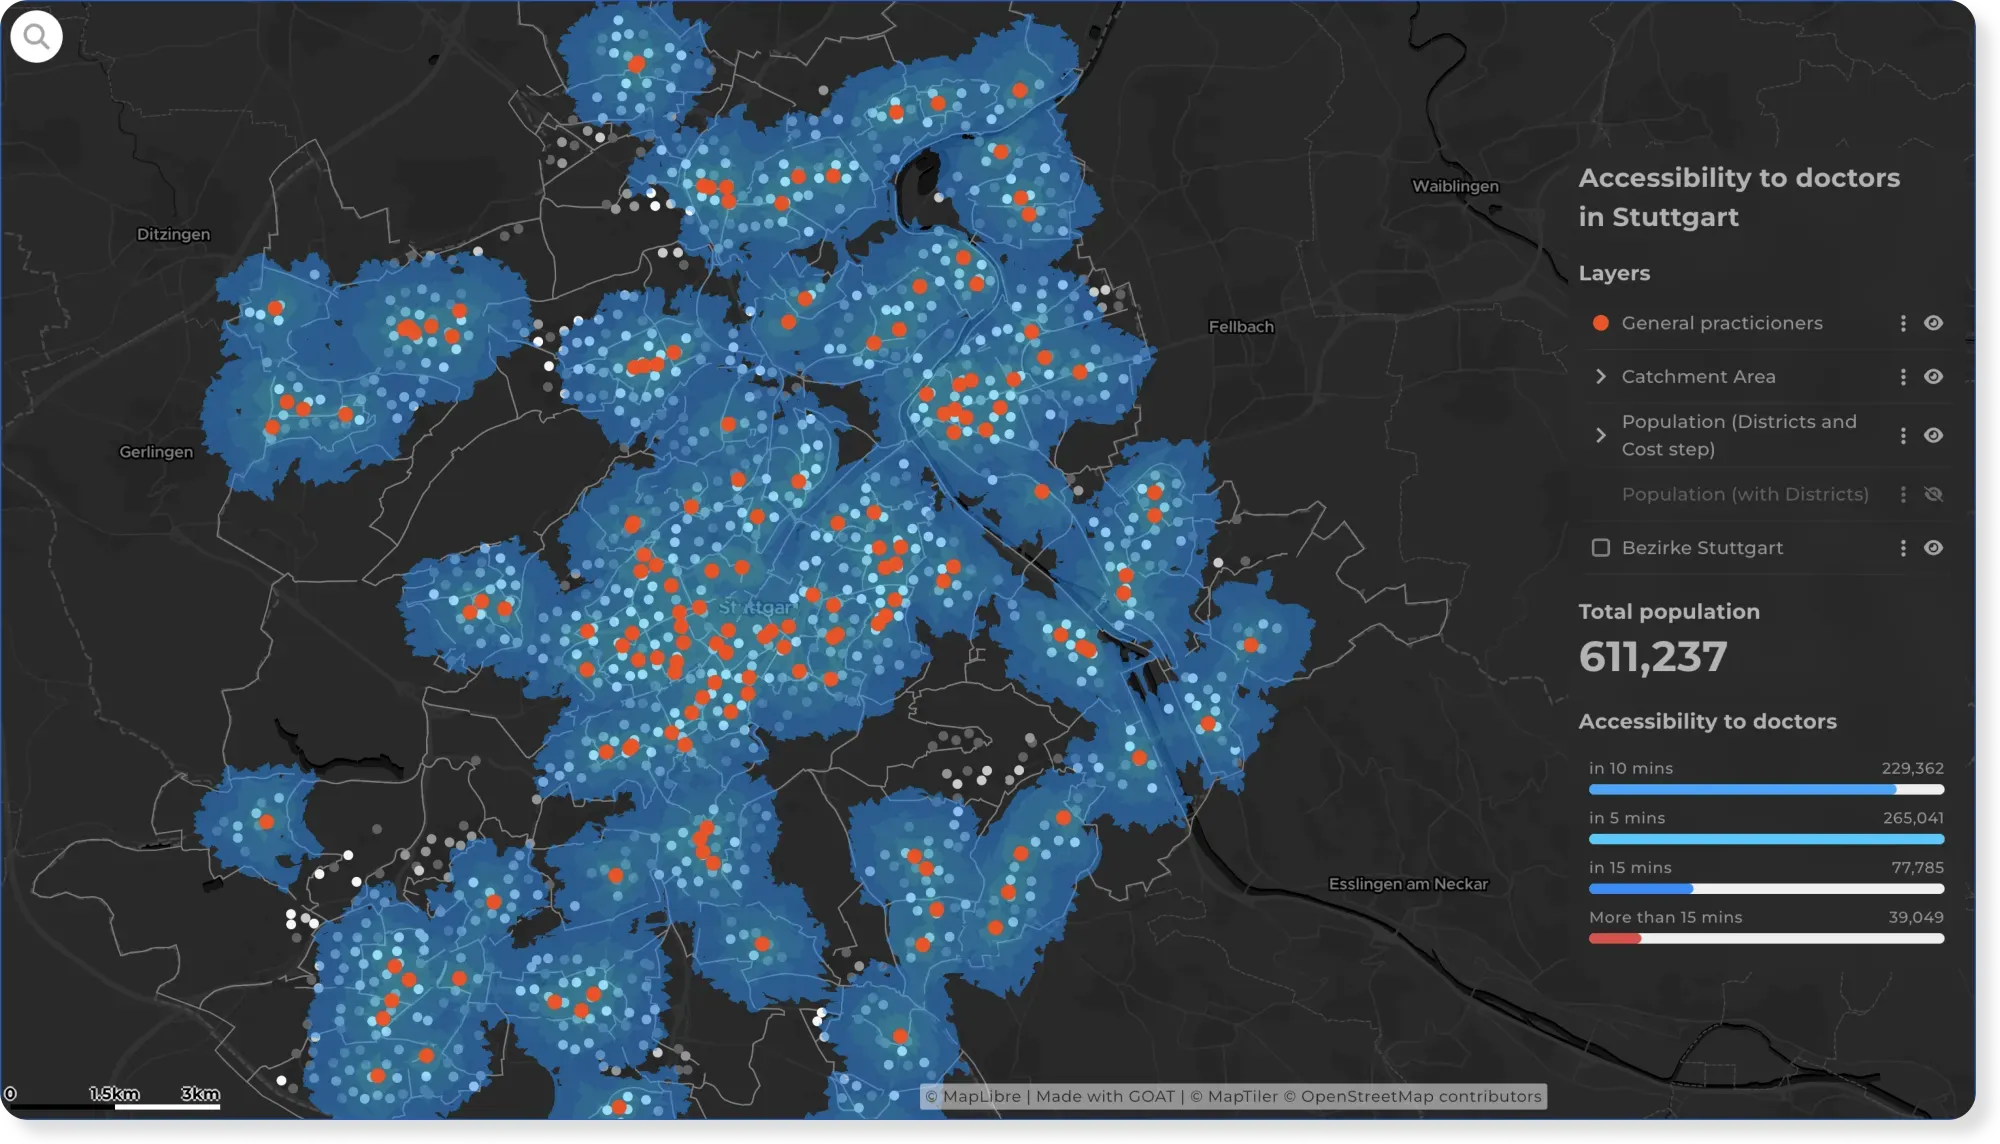
- Healthcare
- Cities & Government
How Easily Can Stuttgart Residents Reach a Doctor?
Reaching a doctor shouldn't depend on where you live. This map shows travel time to GPs across Stuttgart, reveals the areas left underserved, and suggests where new practices should go.
See the map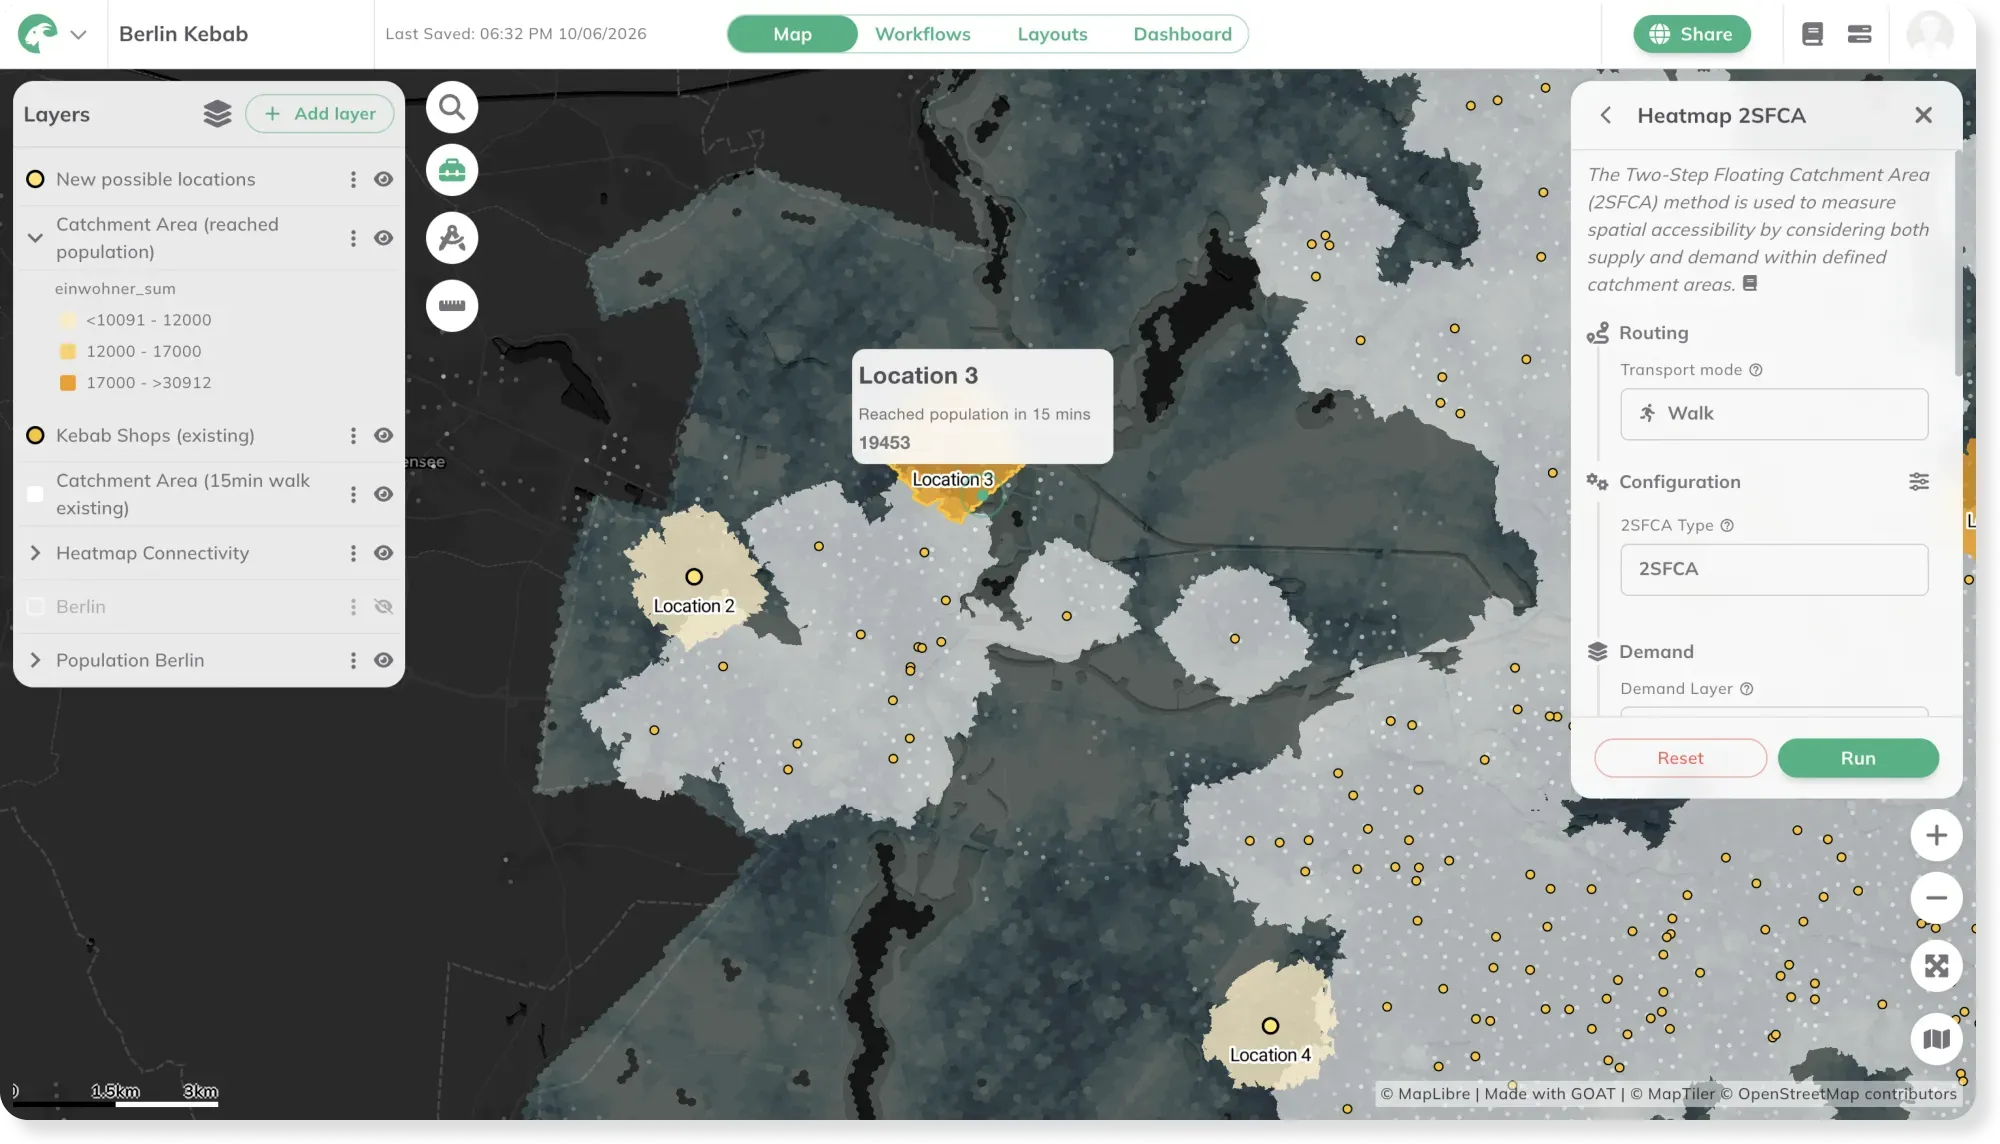
- Retail
- Cities & Government
Retail Site Selection: Where Should the Next Shop Open?
Where's the gap in the market for a new shop? This map ranks potential sites by how many people can reach them on foot, and where demand goes unmet.
See the map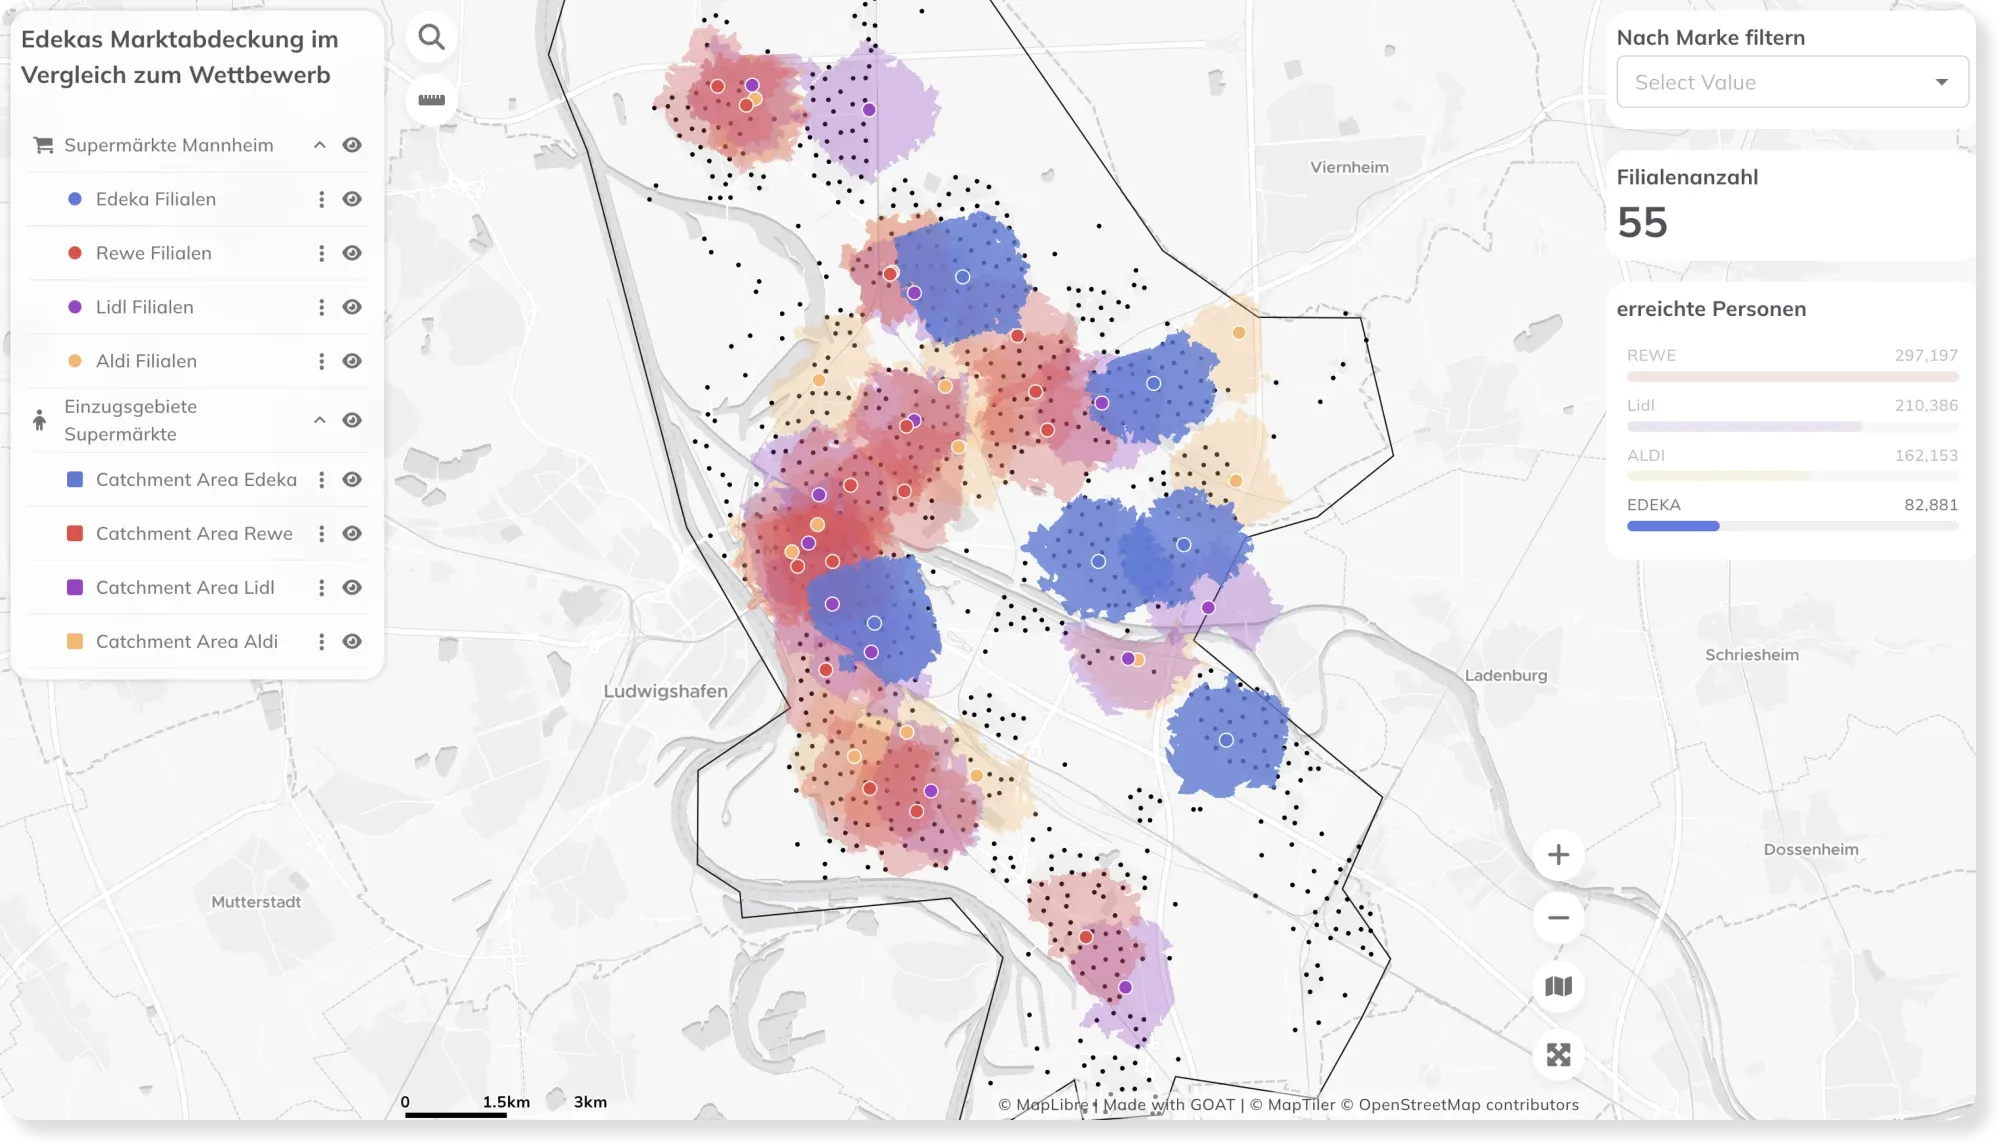
- Retail
Branch Network Planning: Market Coverage and Site Selection
How much of the market does your branch network reach — and where's the gap for a new store? This map compares locations by catchment, competition, and population reached.
See the map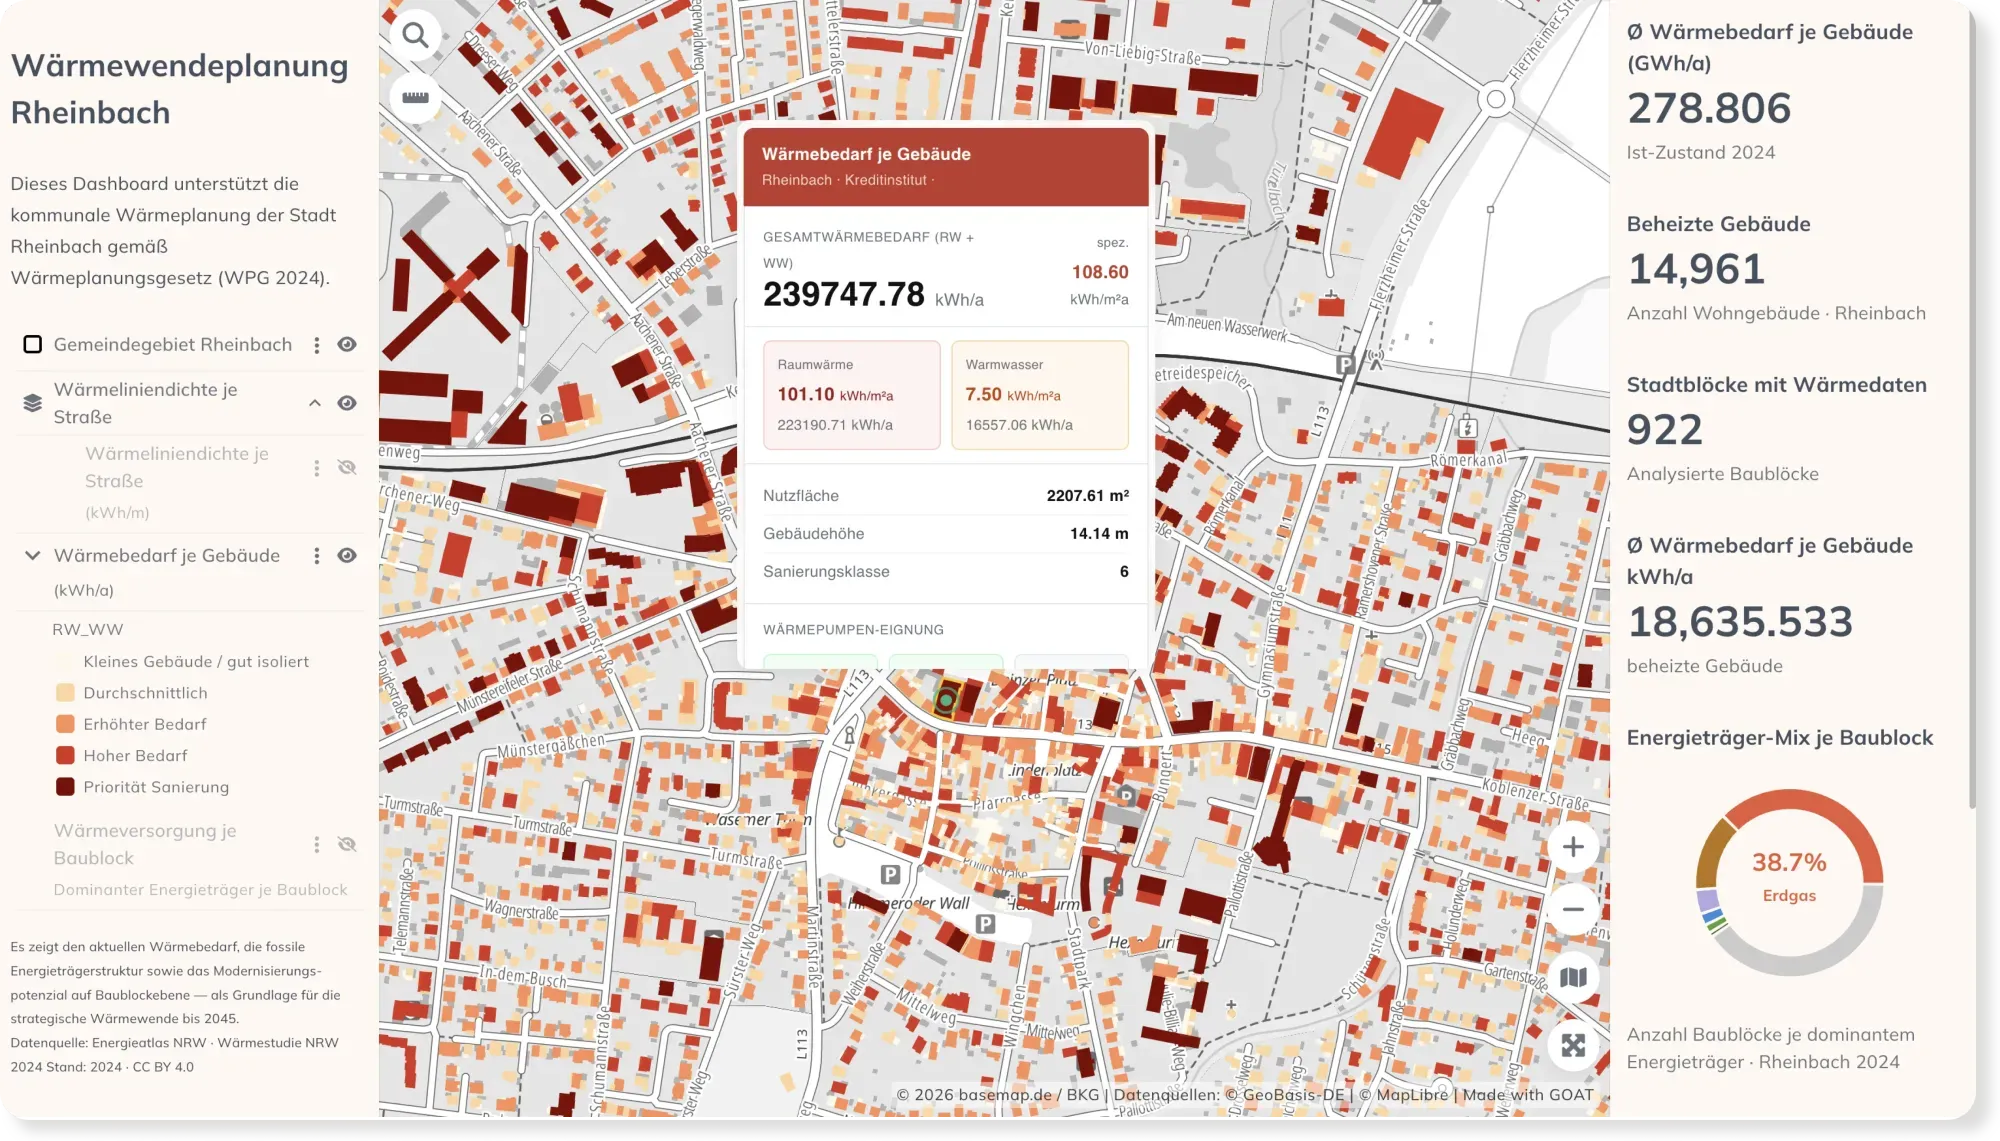
- Energy
- Sustainability & Climate Risk
- Cities & Government
Municipal Heat Planning: Heat Demand & Retrofit Priorities in Rheinbach
Germany's Heat Planning Act gives every municipality a deadline to plan its heat transition. This dashboard maps building-level heat demand, the energy mix, and retrofit priorities for Rheinbach.
See the map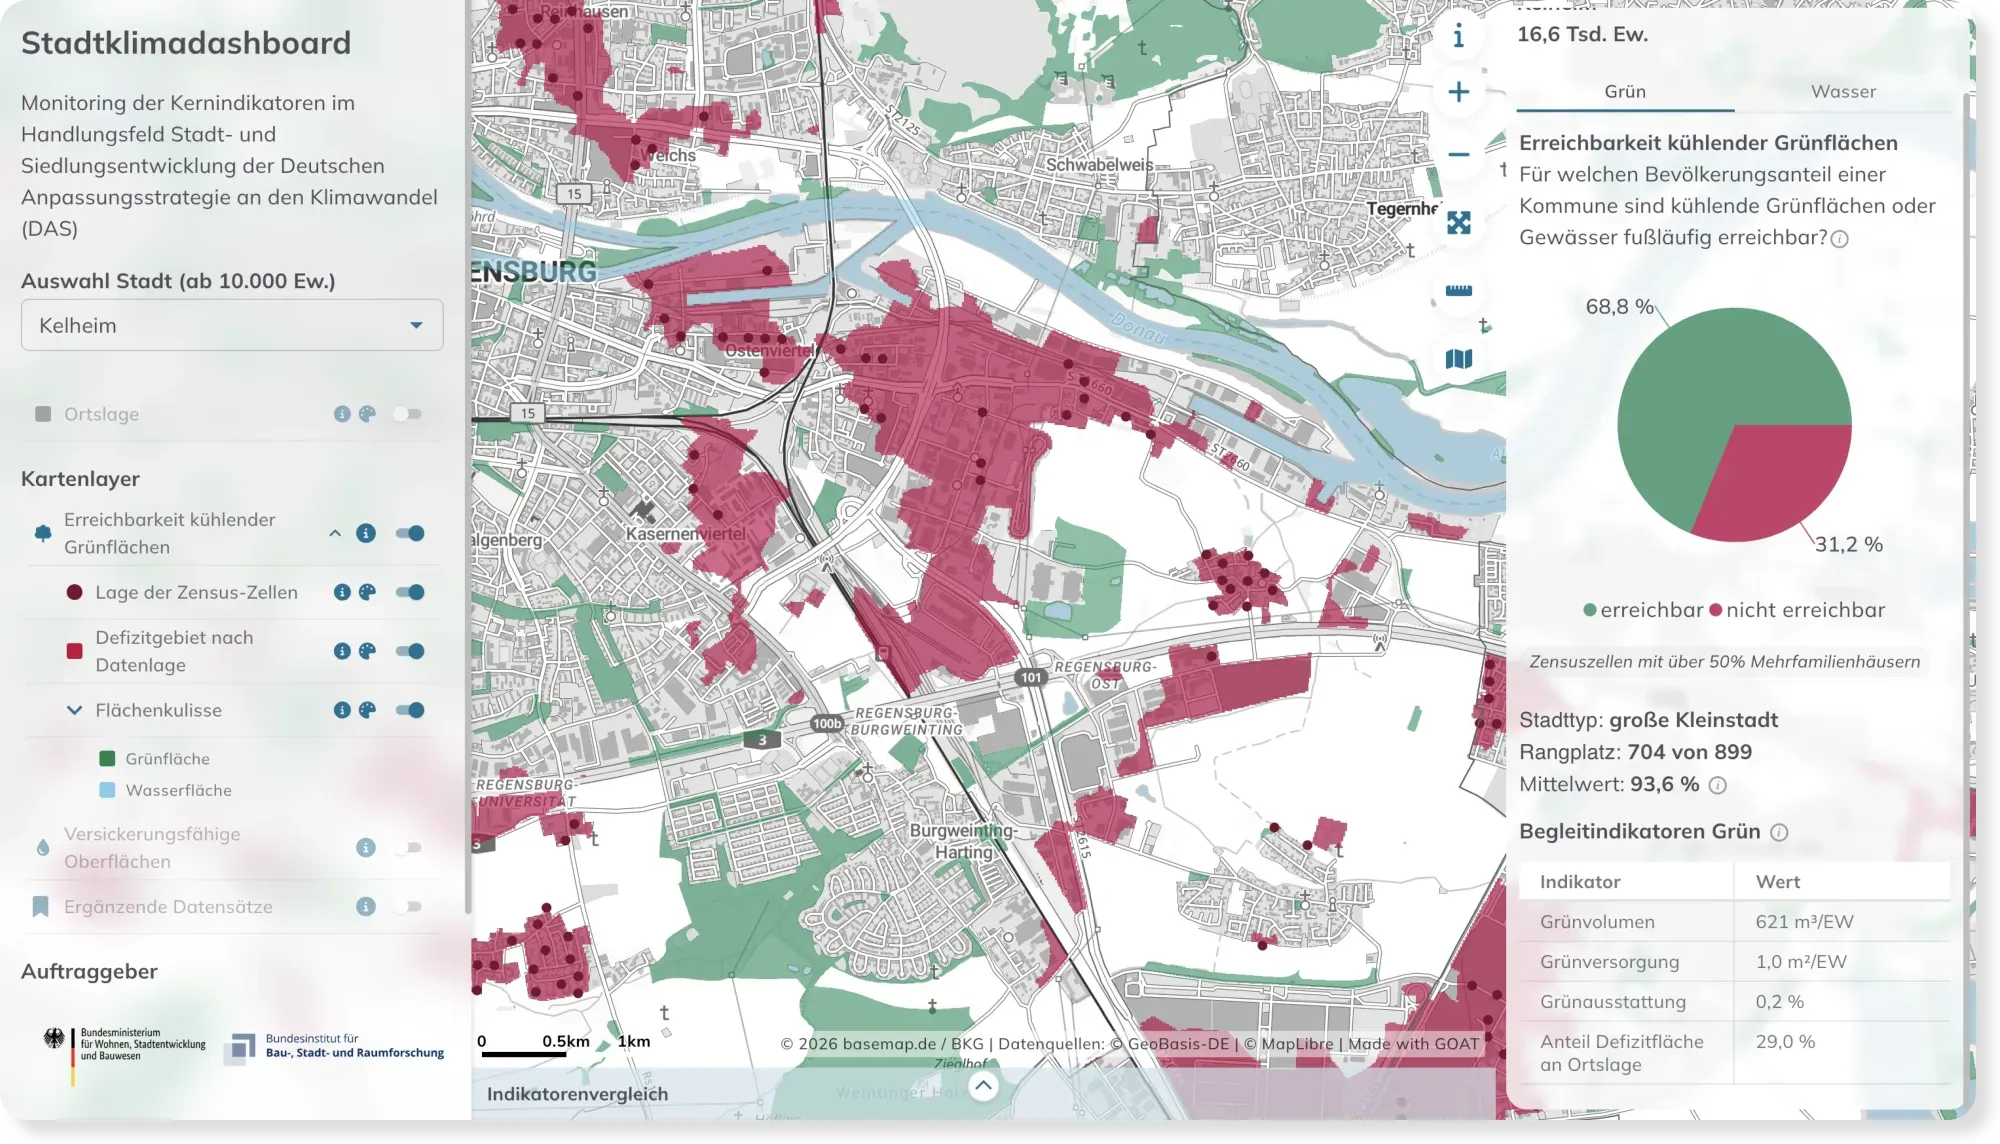
- Sustainability & Climate Risk
Stadtklimadashboard: Monitoring Climate Adaptation Across Germany's Cities
How ready are Germany's cities for extreme heat? The Stadtklimadashboard maps access to cooling green space and permeable surfaces for every German city over 10,000 inhabitants.
See the map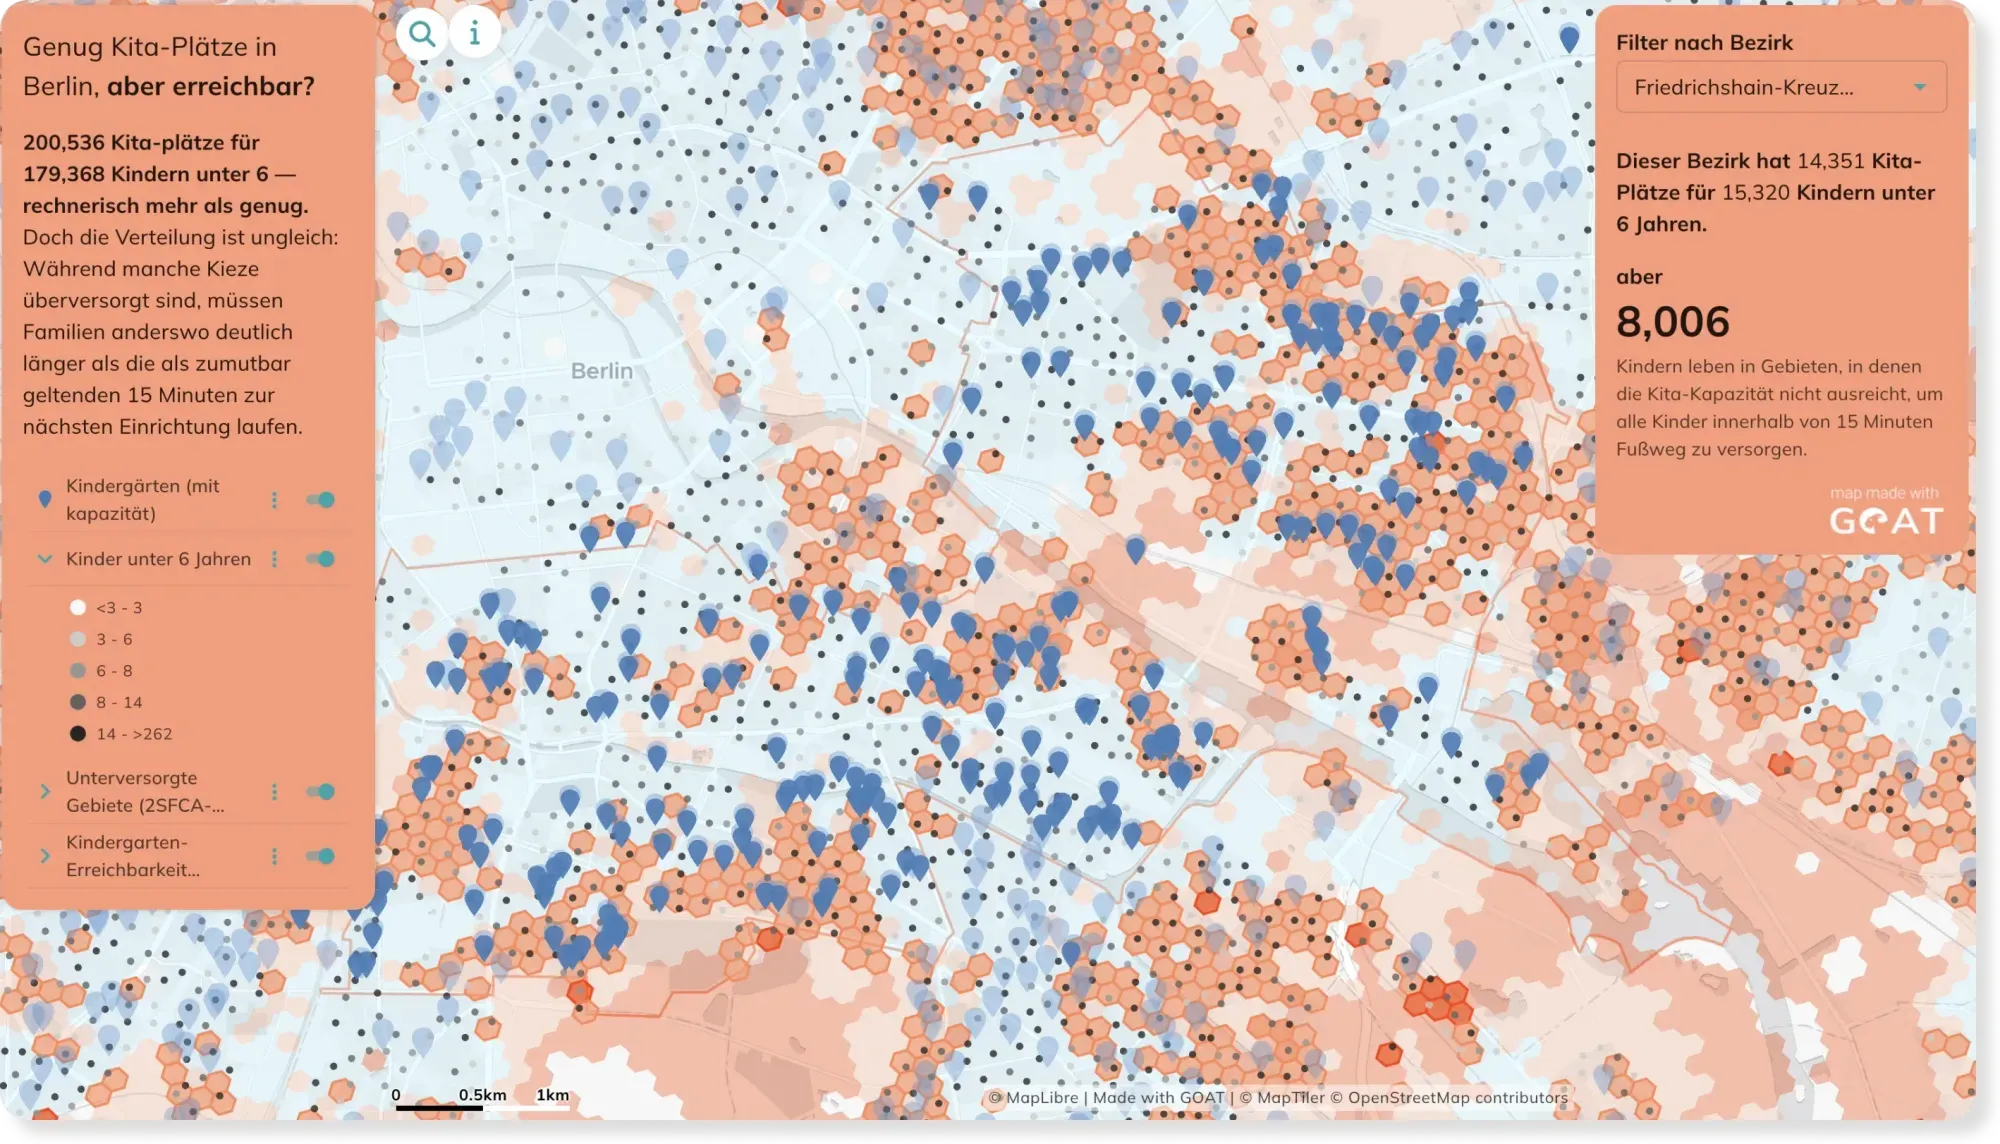
- Mobility Planning
- Cities & Government
Kindergarden accessibility in Berlin: Distance and Capacity combined
A kindergarden five minutes away doesn't help if every place is already taken. This map goes beyond simple distance and factors in capacity too — showing where families are truly cared for.
See the map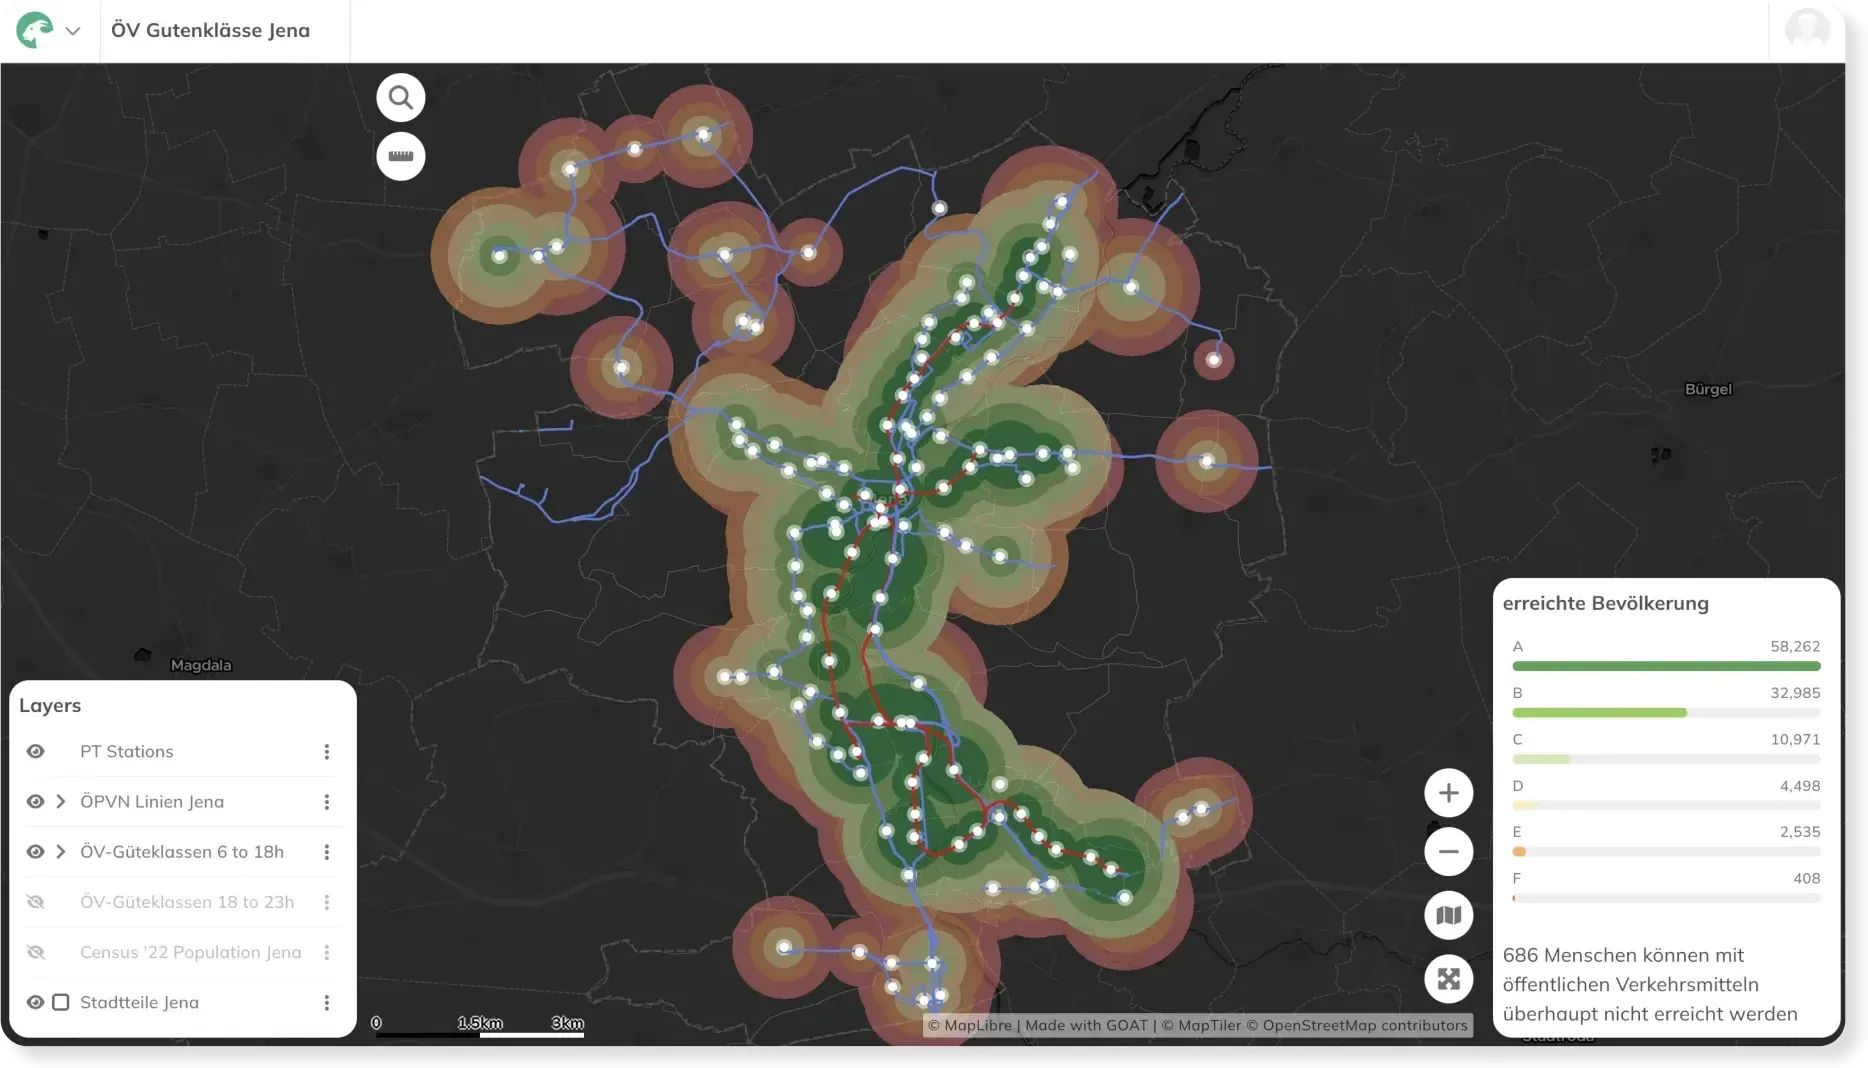
- Mobility Planning
- Cities & Government
Transit Accessibility Analysis
This map shows the Public Transport Quality Classes (ÖV-Güteklassen) highlighting the attractiveness of public transport services for Jena.
See the map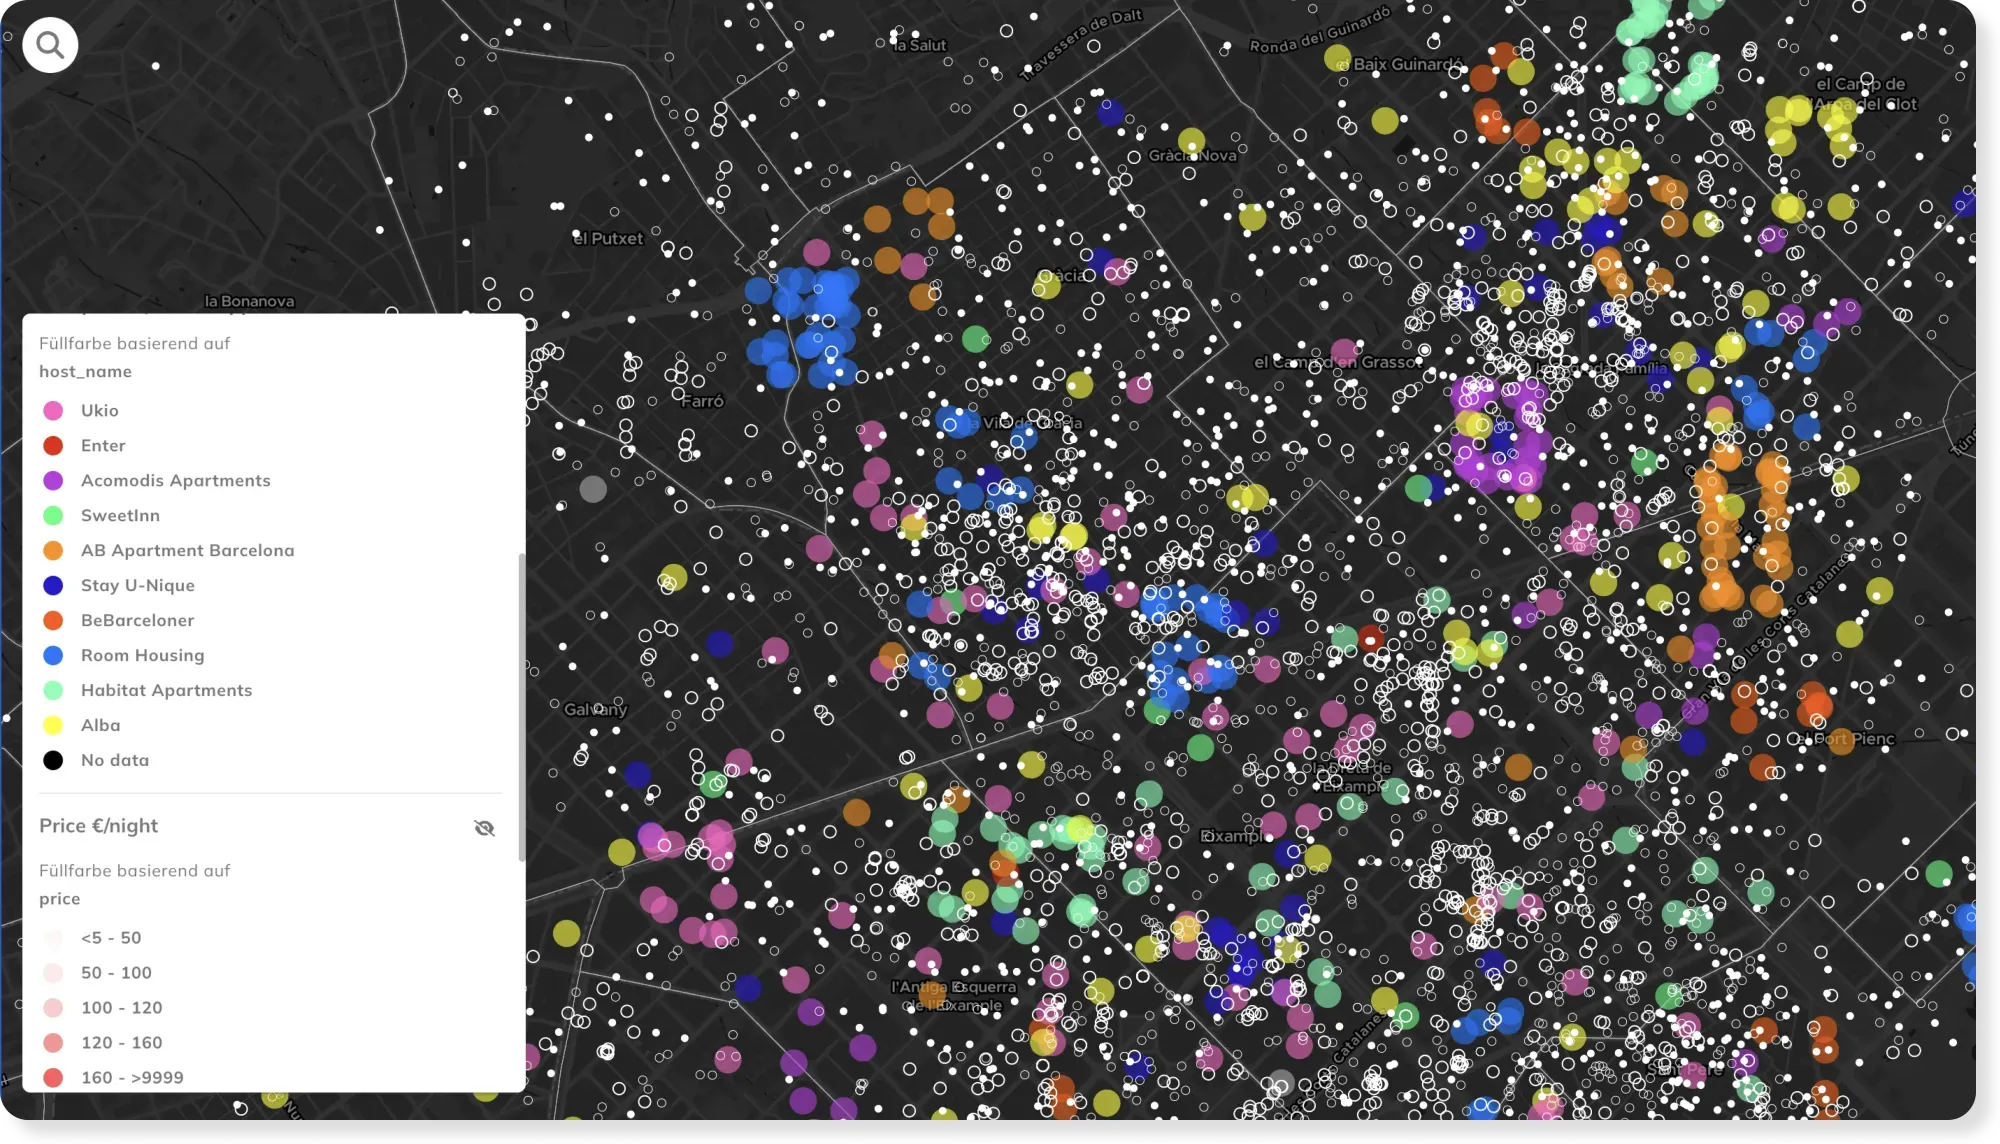
- Real Estate
- Cities & Government
Short-Term Rental Monitoring
The rapid rise of Airbnb has sparked major debates in cities worldwide. This map looks into Barcelona's Airbnb landscape.
See the map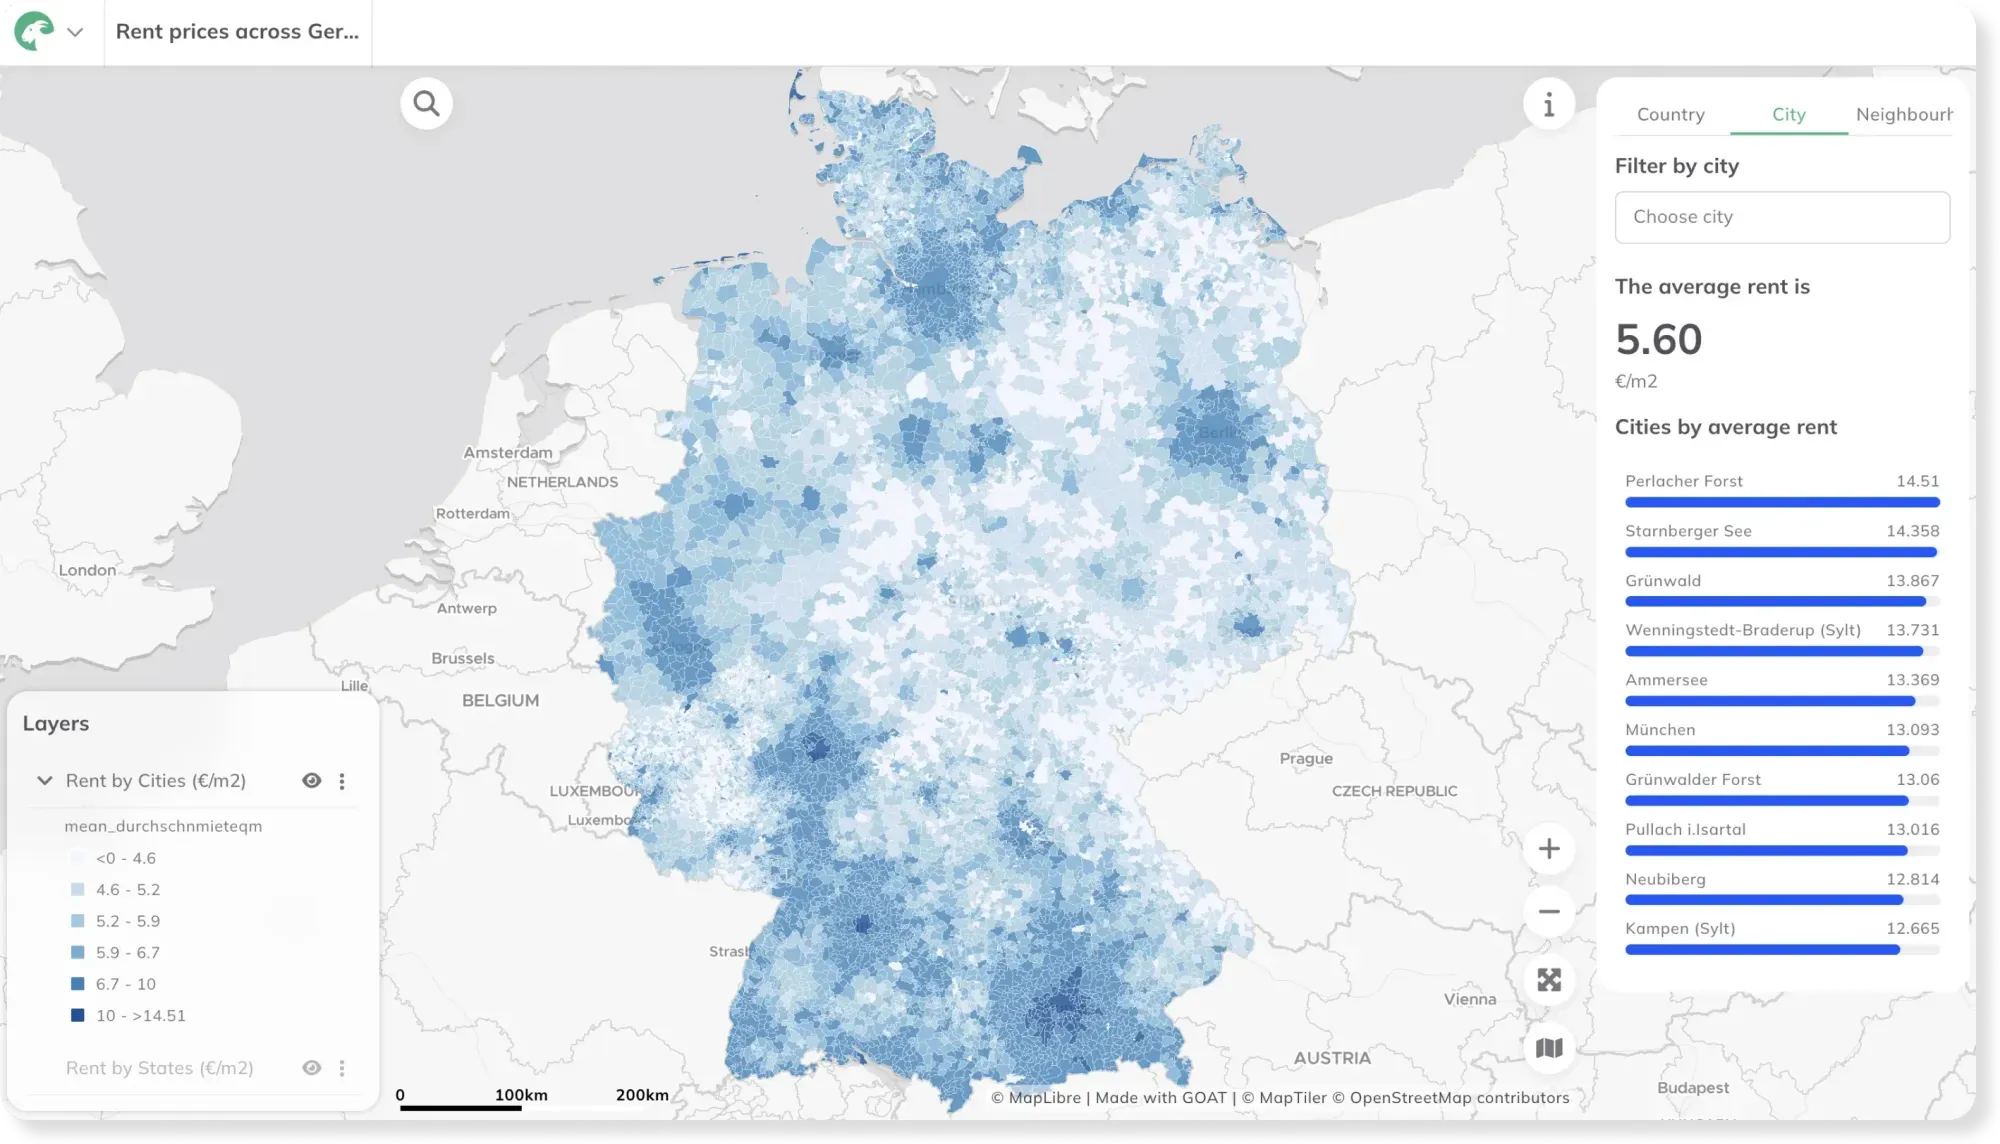
- Real Estate
- Cities & Government
Rent prices across Germany
With rising rental prices impacting cities across the world, this map visualizes net rent per m² in Germany across different administrative boundaries
See the map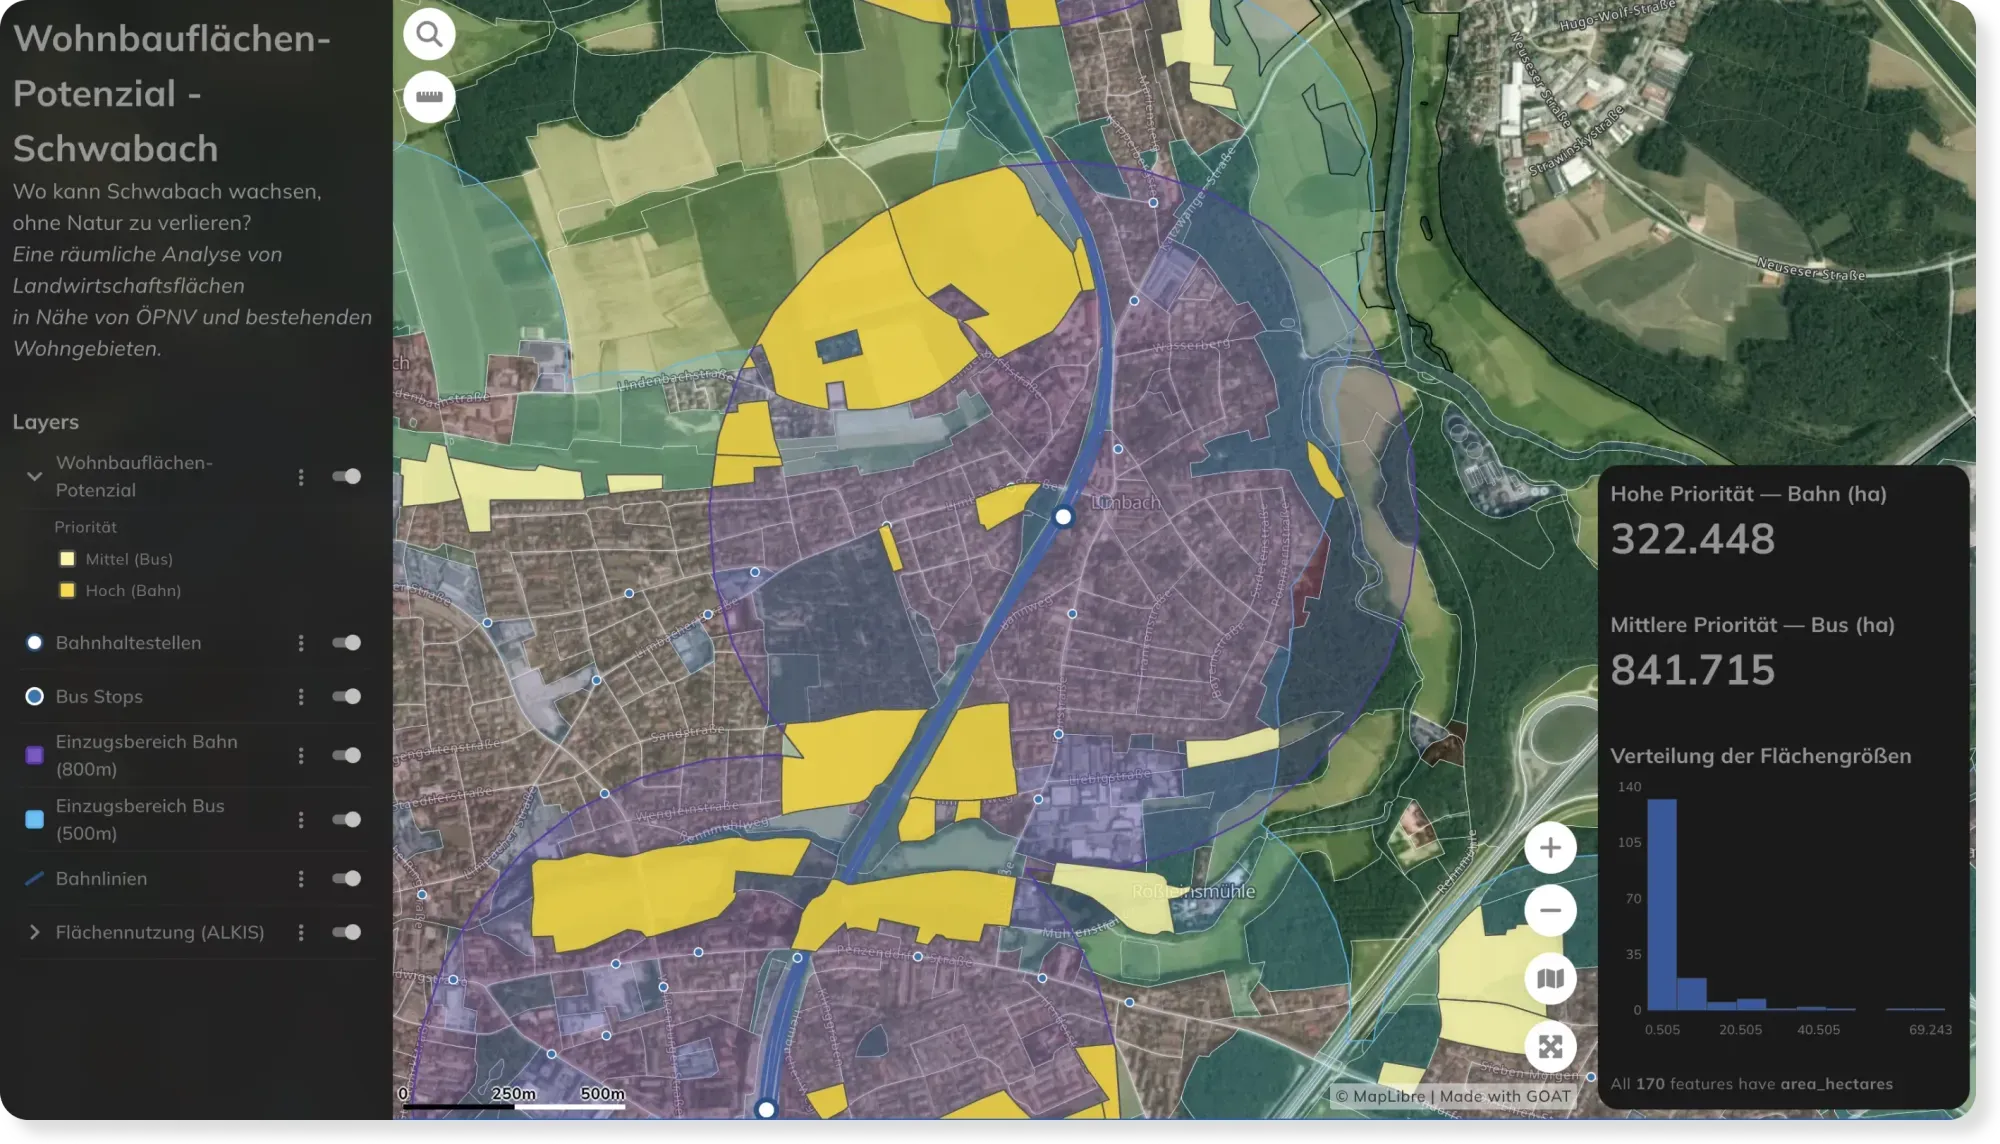
- Cities & Government
- Real Estate
Land Use & Development Potential in Schwabach
See how land is used across Schwabach — and where there's room to grow. An open land-use map for planners, developers, and citizens.
See the map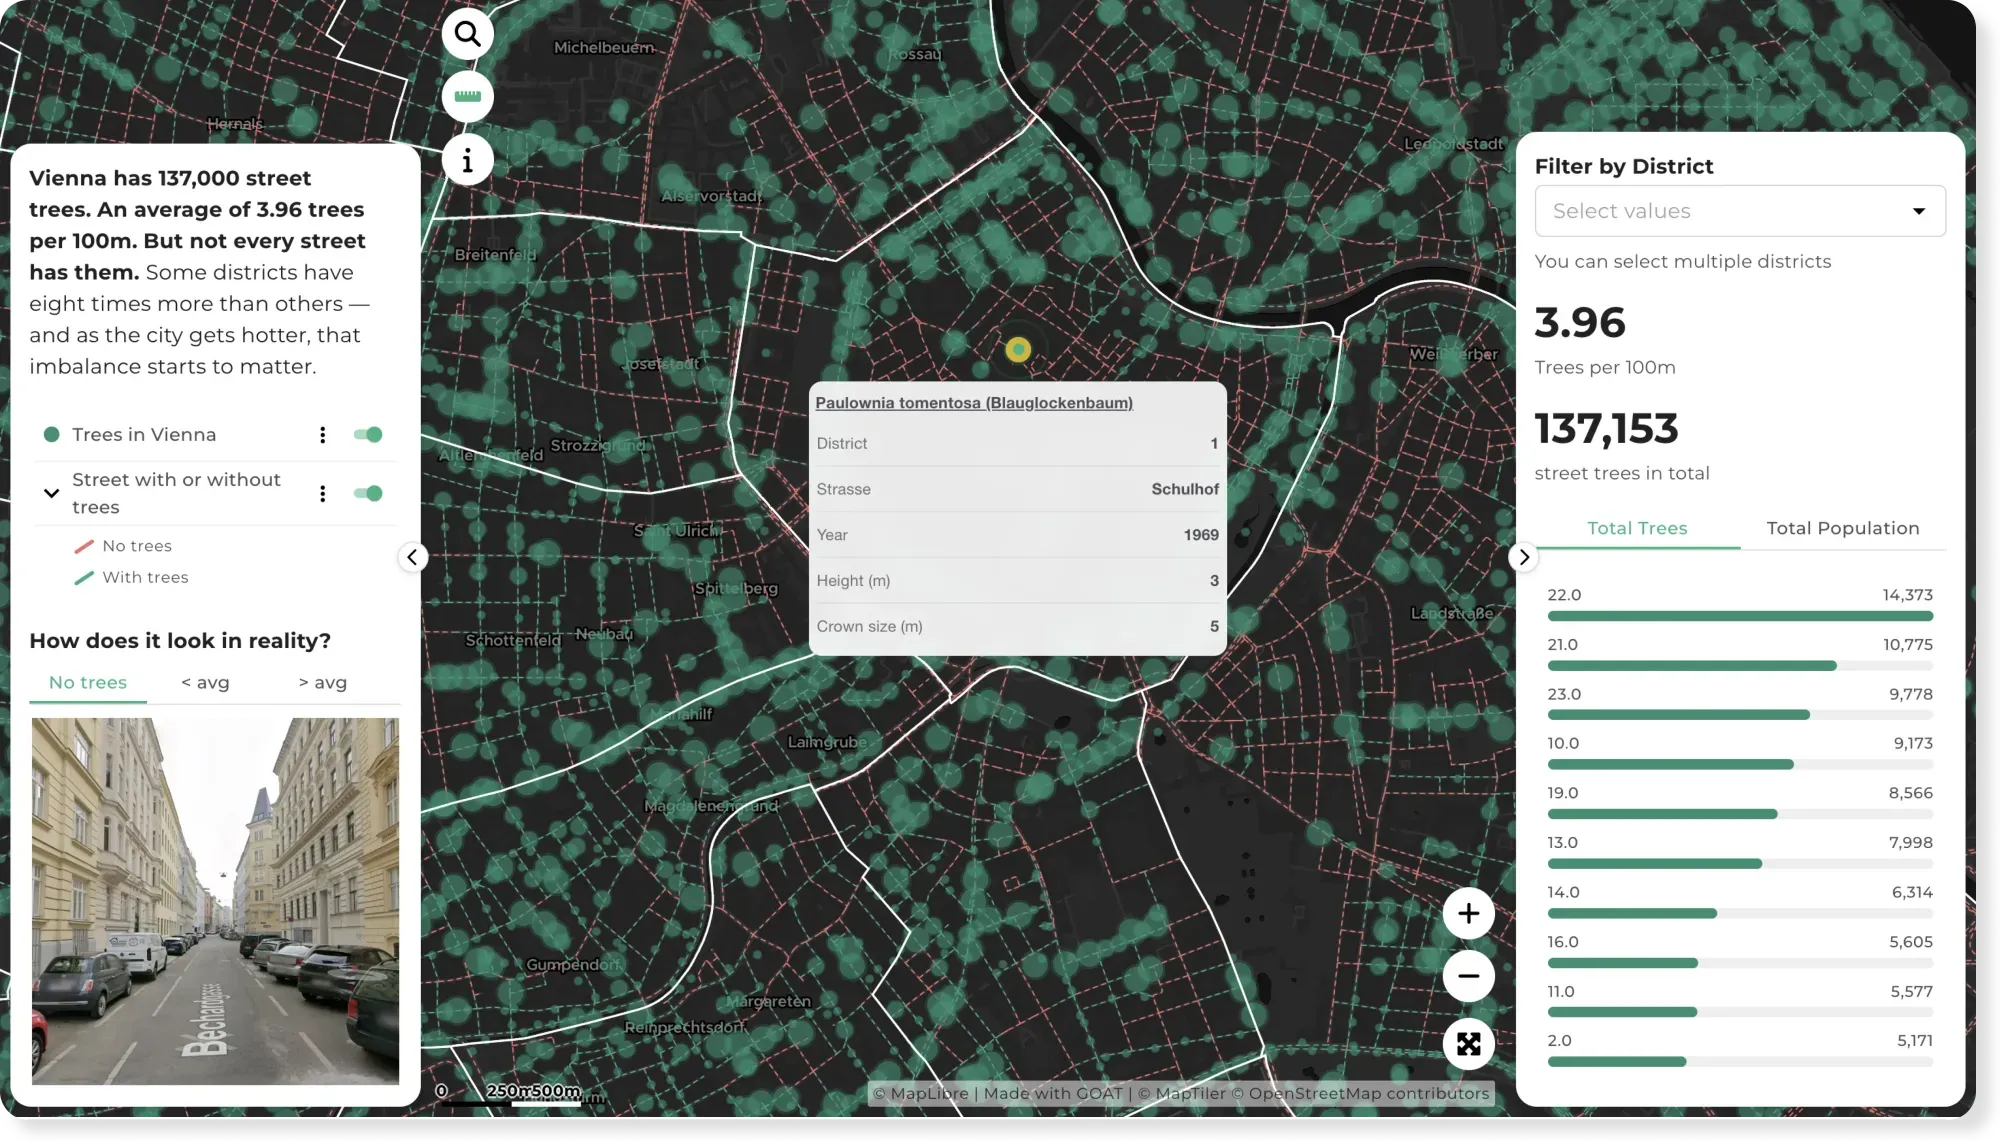
- Sustainability & Climate Risk
- Cities & Government
Vienna's 137,000 Street Trees — and Where the Shade Runs Out
Vienna has around 137,000 street trees — but some districts have eight times more than others. This map shows where the street canopy gives shade, and where it doesn't.
See the map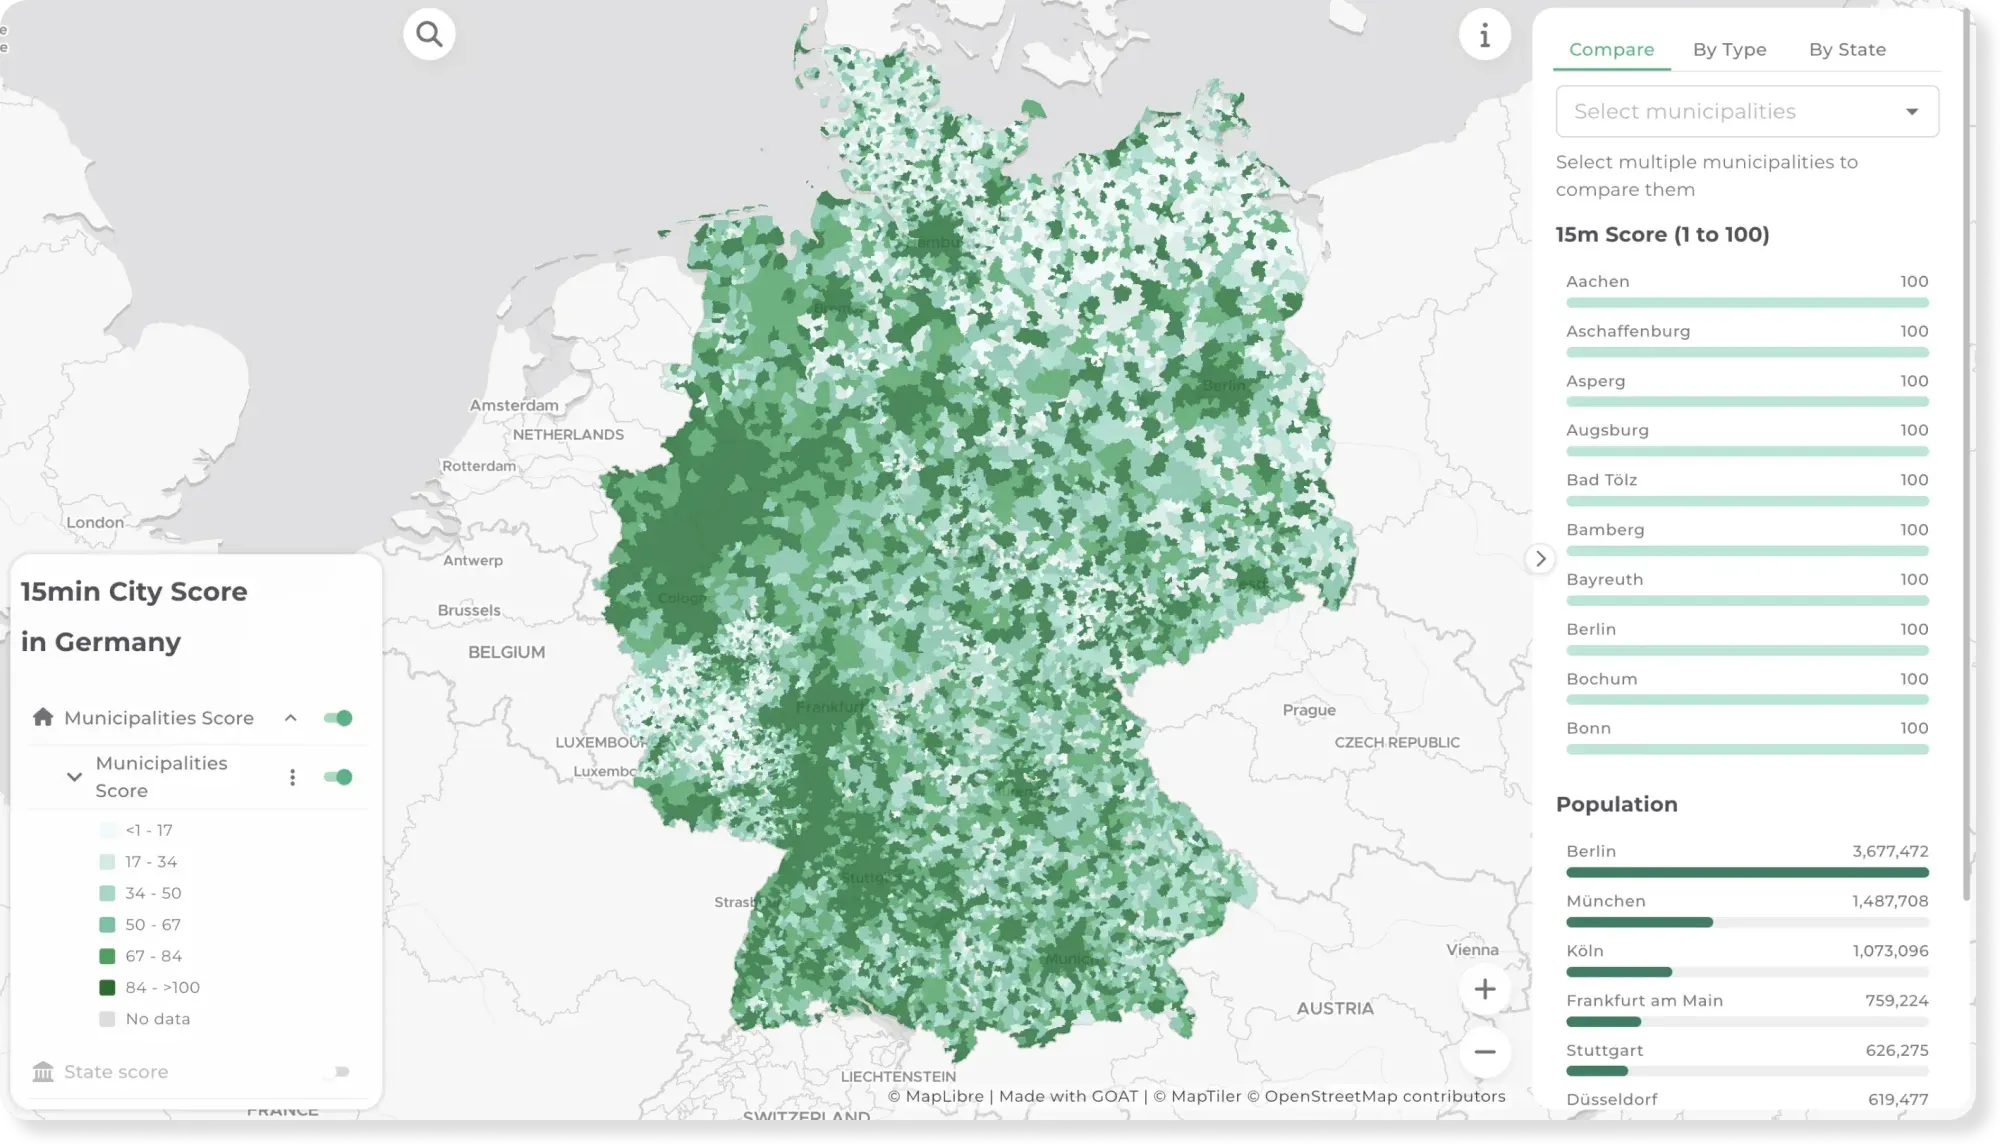
- Mobility Planning
- Cities & Government
15-minute City Score across Germany
Can you cover daily needs within a 15-minute walk? This map scores every municipality and state in Germany on the 15-minute city concept.
See the map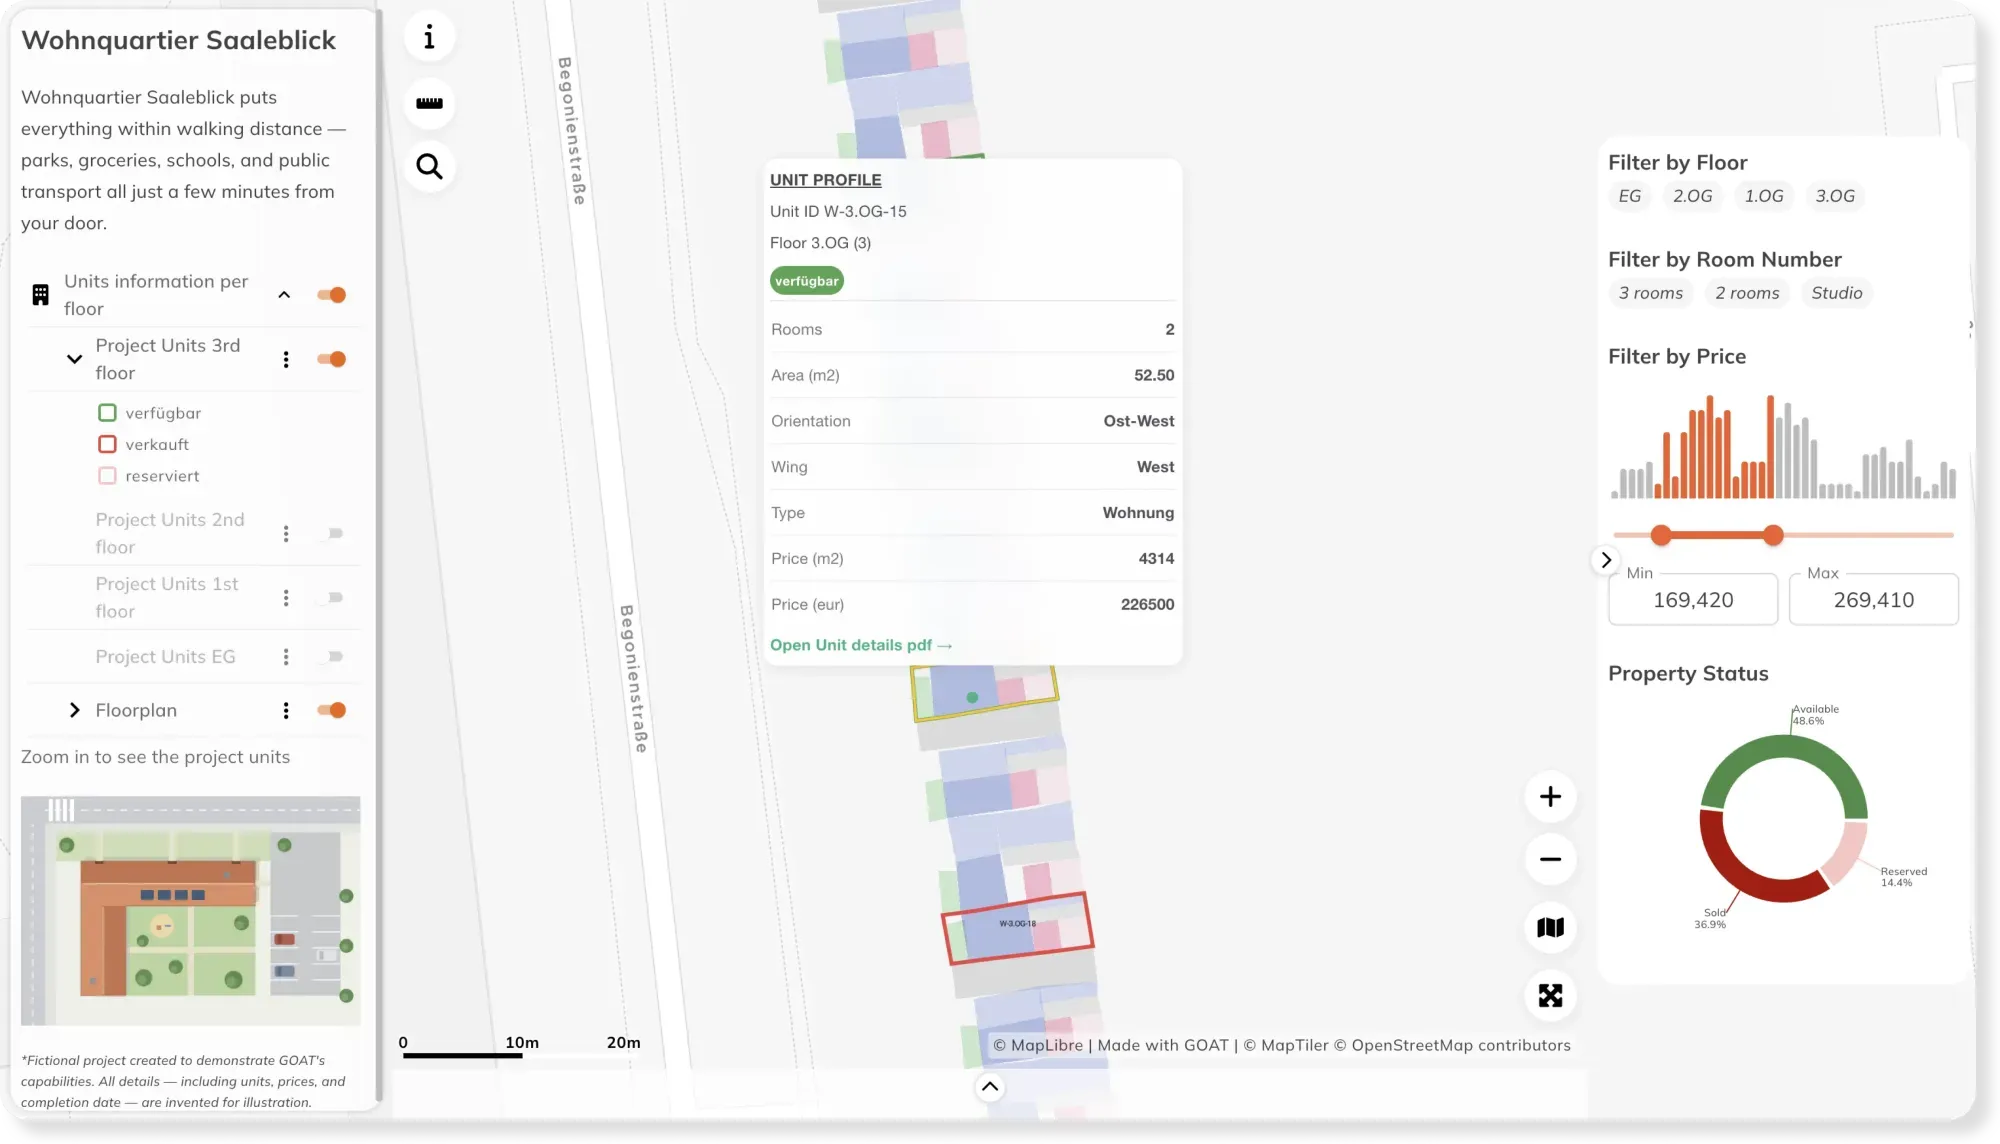
- Real Estate
Property Sales Dashboard
Give buyers more than a brochure. With GOAT, present your development as an interactive map — location, apartments, floor plans, and availability in one place buyers can explore.
See the map
Ready to make sense of your data?
Join planners, organizations and cities using GOAT to make better decisions, faster. No GIS expertise needed.