
Back to the Gallery Map Gallery
Rooftop Solar Potential vs. Energy Demand per Block — Bedburg
How much energy could a city's rooftops cover? This dashboard compares rooftop solar potential with heat demand per block in Bedburg, revealing priority zones for solar expansion.
How much of a city’s energy demand could its own rooftops cover? This dashboard sets the solar potential of Bedburg’s roofs against the heat demand of each city block — showing where generation and consumption line up, and where they don’t. From that comparison it derives the priority zones for solar expansion: the blocks where investing in PV would do the most for the local energy balance. As a foundation for the municipal energy transition to 2045, it turns scattered building and solar data into one clear, block-level map that municipalities, utilities, and energy planners can act on.
More maps to explore
- Energy
- Sustainability & Climate Risk
- Cities & Government
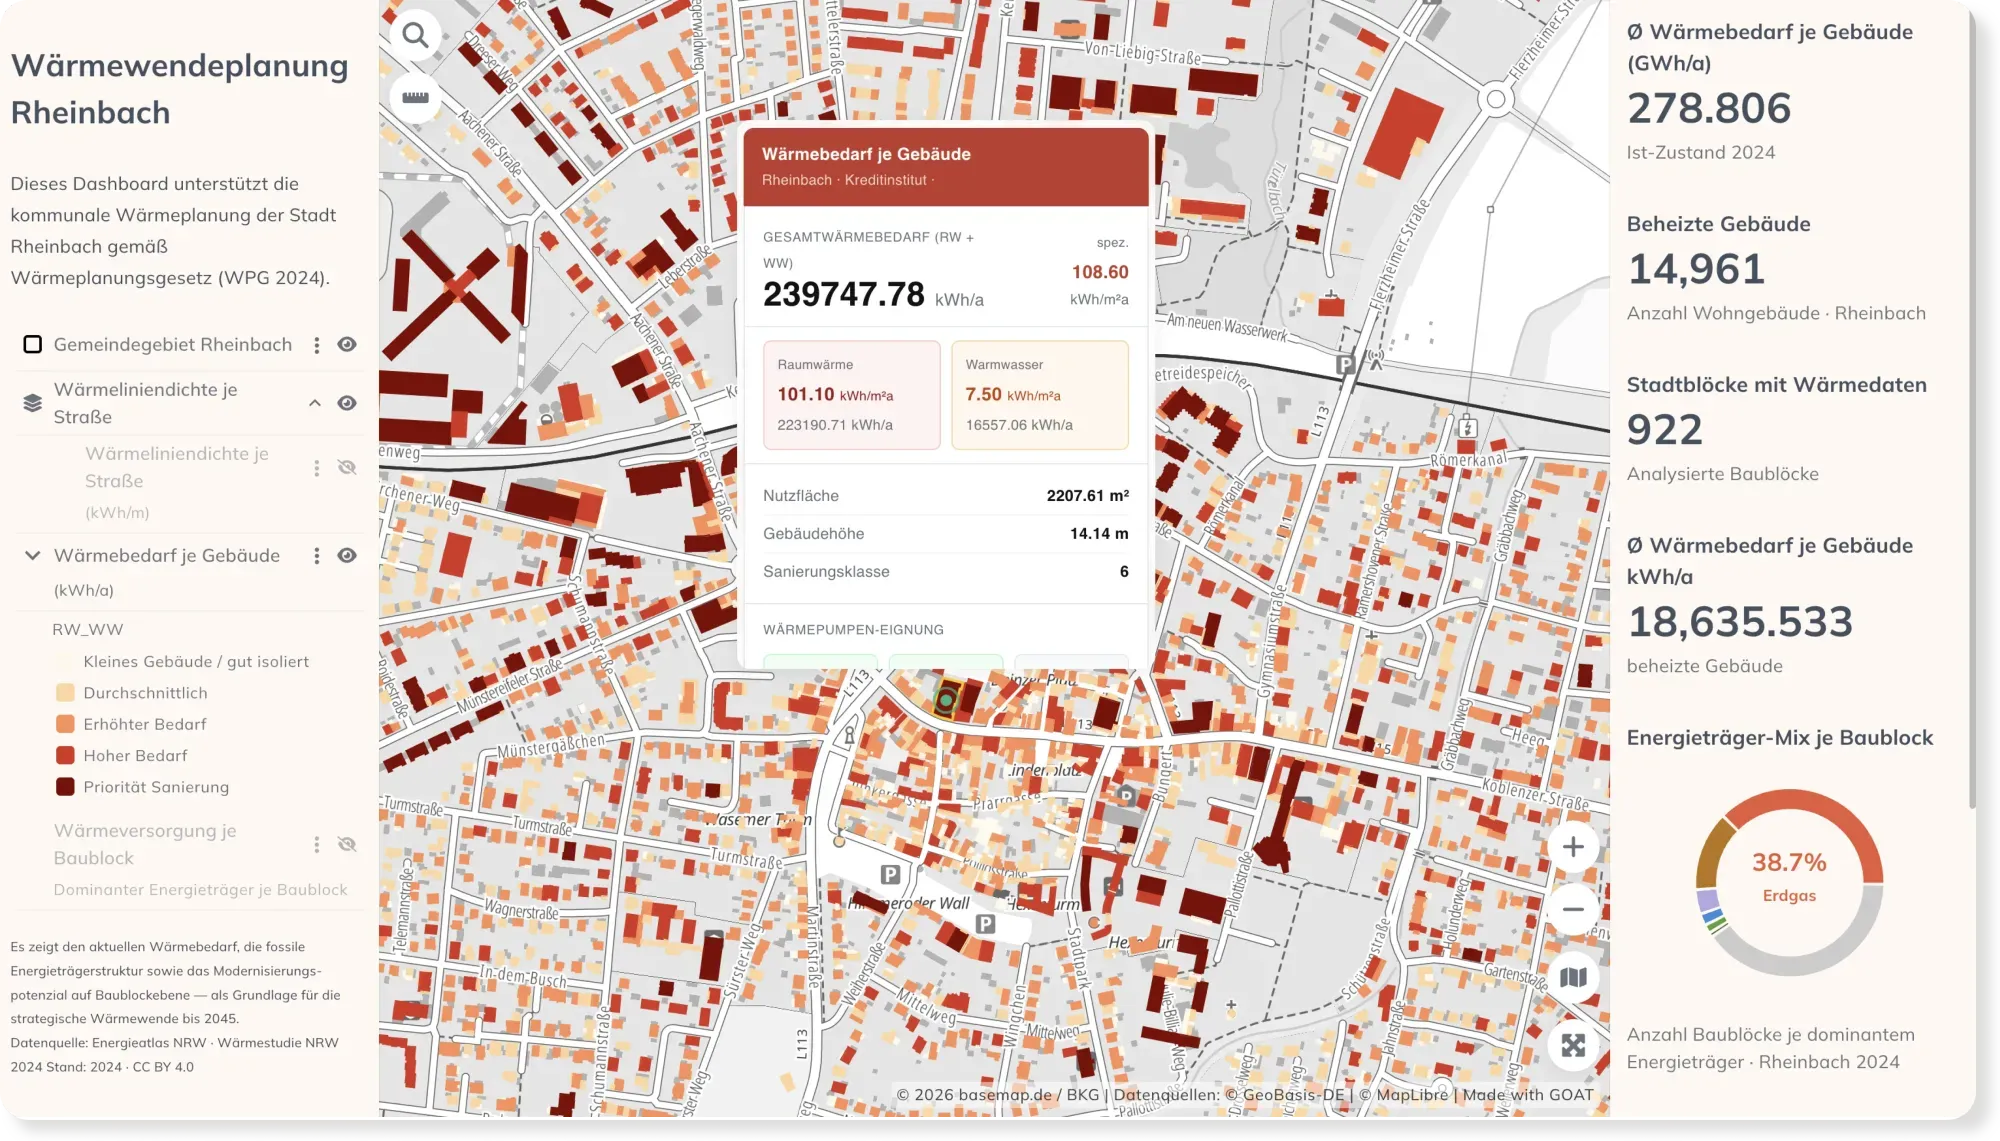
Municipal Heat Planning: Heat Demand & Retrofit Priorities in Rheinbach
Germany's Heat Planning Act gives every municipality a deadline to plan its heat transition. This dashboard maps building-level heat demand, the energy mix, and retrofit priorities for Rheinbach.
See the map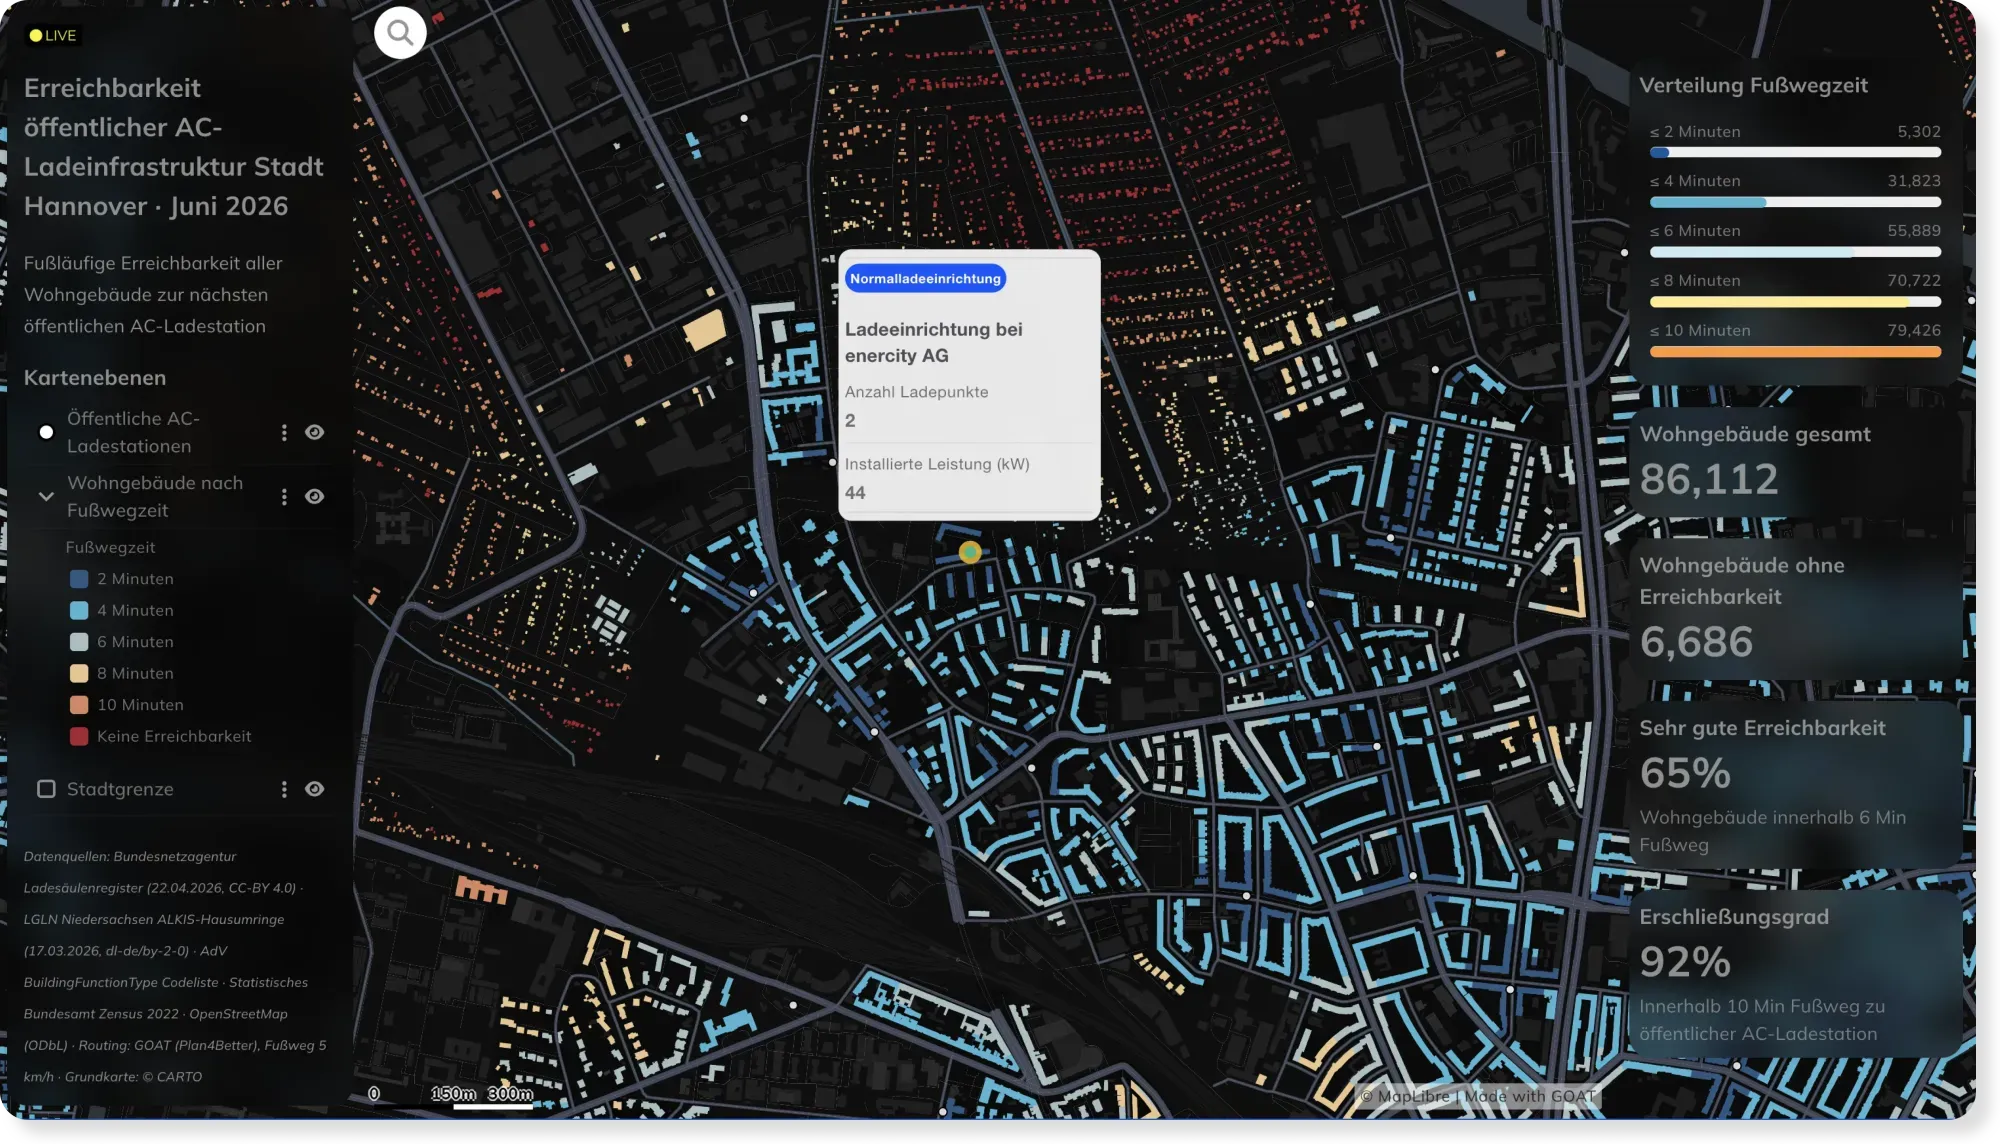
- Energy
- Mobility Planning
Live EV Charging Accessibility in Hannover, Powered by Automated Workflows
Charging networks change weekly. This Hannover dashboard stays current automatically — custom SQL and scheduled workflows recompute walking access to every AC charger as the data updates.
See the map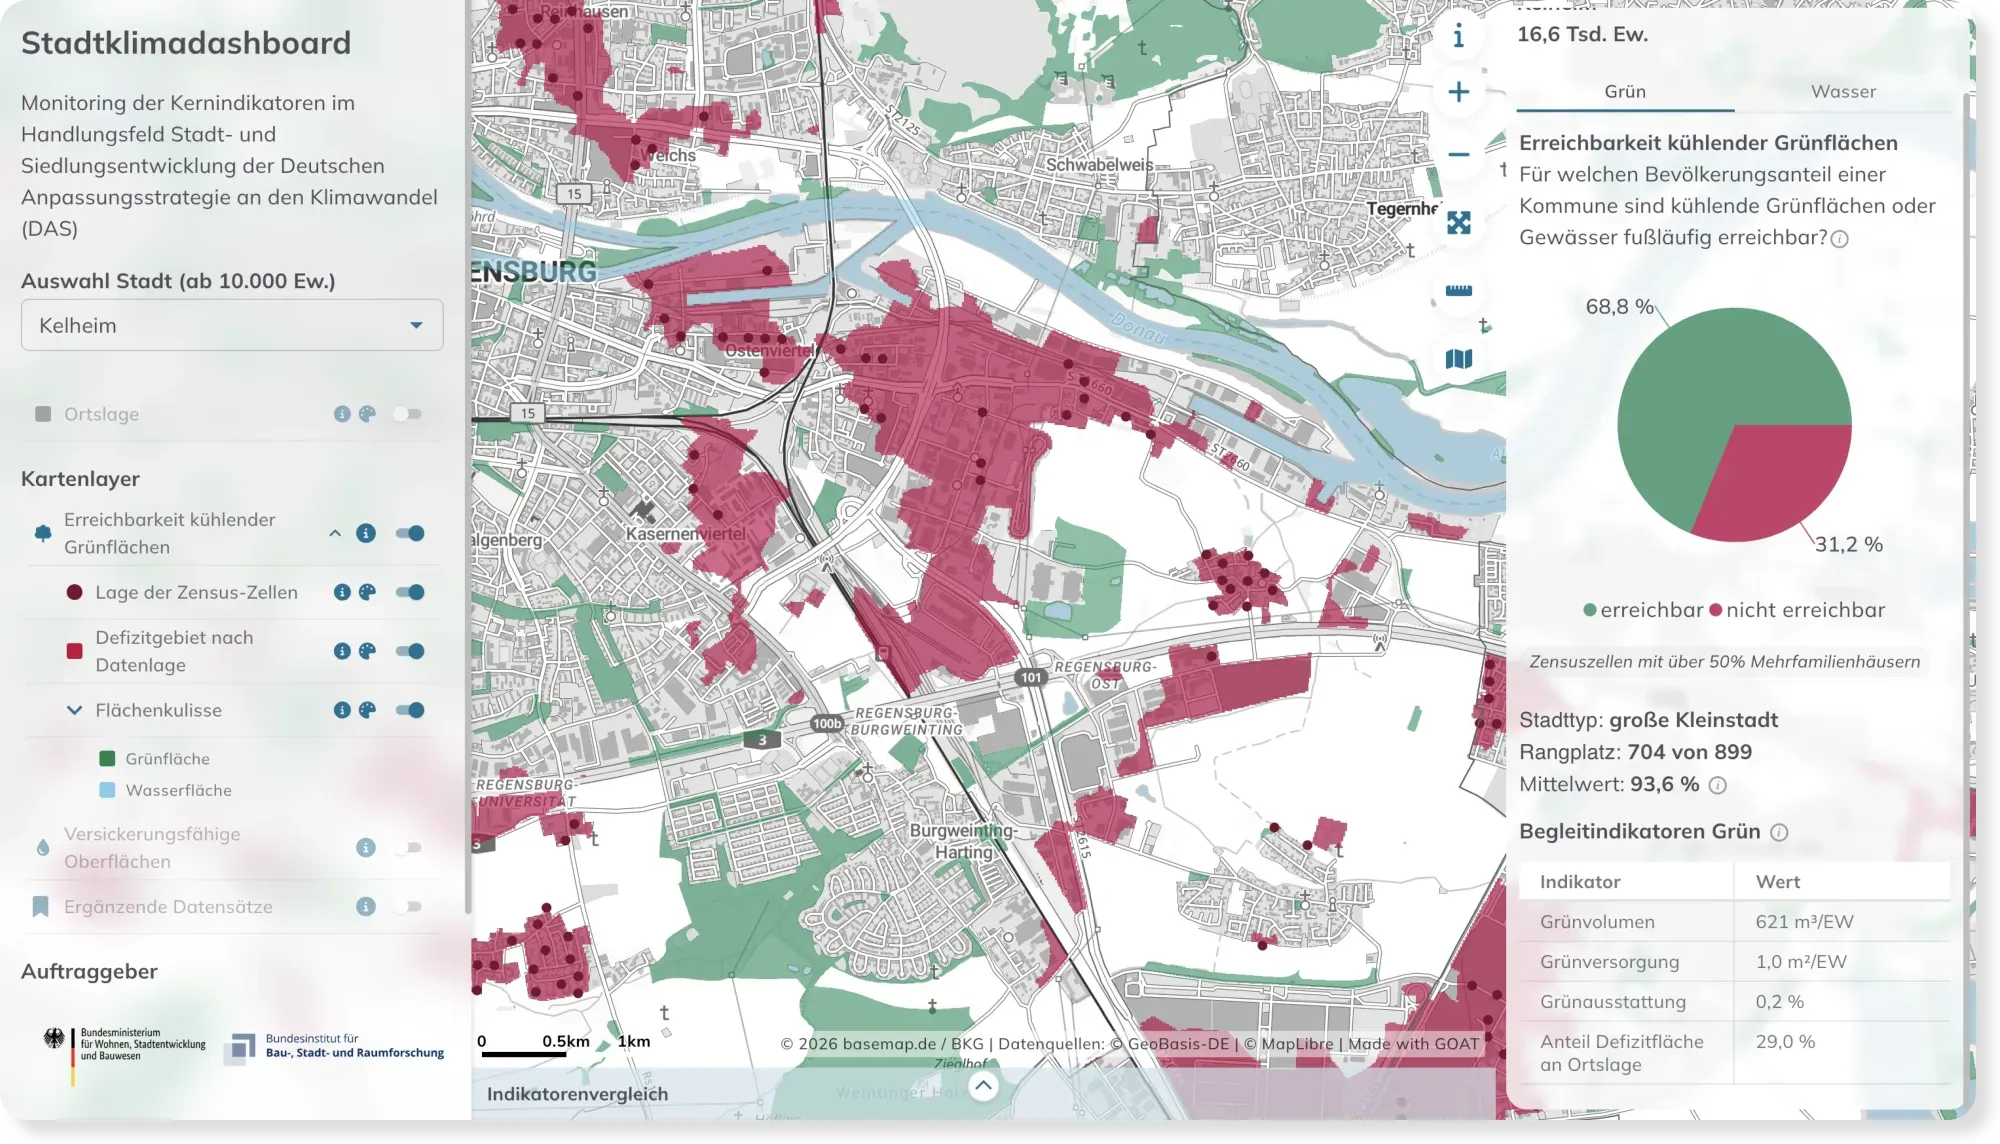
- Sustainability & Climate Risk
Stadtklimadashboard: Monitoring Climate Adaptation Across Germany's Cities
How ready are Germany's cities for extreme heat? The Stadtklimadashboard maps access to cooling green space and permeable surfaces for every German city over 10,000 inhabitants.
See the map
Ready to make sense of your data?
Join planners, organizations and cities using GOAT to make better decisions, faster. No GIS expertise needed.