Plan4Better

Industries

Retail

Successful retail planning depends on understanding location — who lives nearby, how they move, and where competitors are. GOAT gives retail planners and development teams the tools to conduct rigorous, data-driven location and accessibility analyses, from catchment area assessments to network-wide gap analysis.

GOAT retail dashboards for understanding locations, finding supply gaps, and planning new locations.
Retail site selection by accessibility in GOAT

Select Sites Based on Spatial Accessibility Data

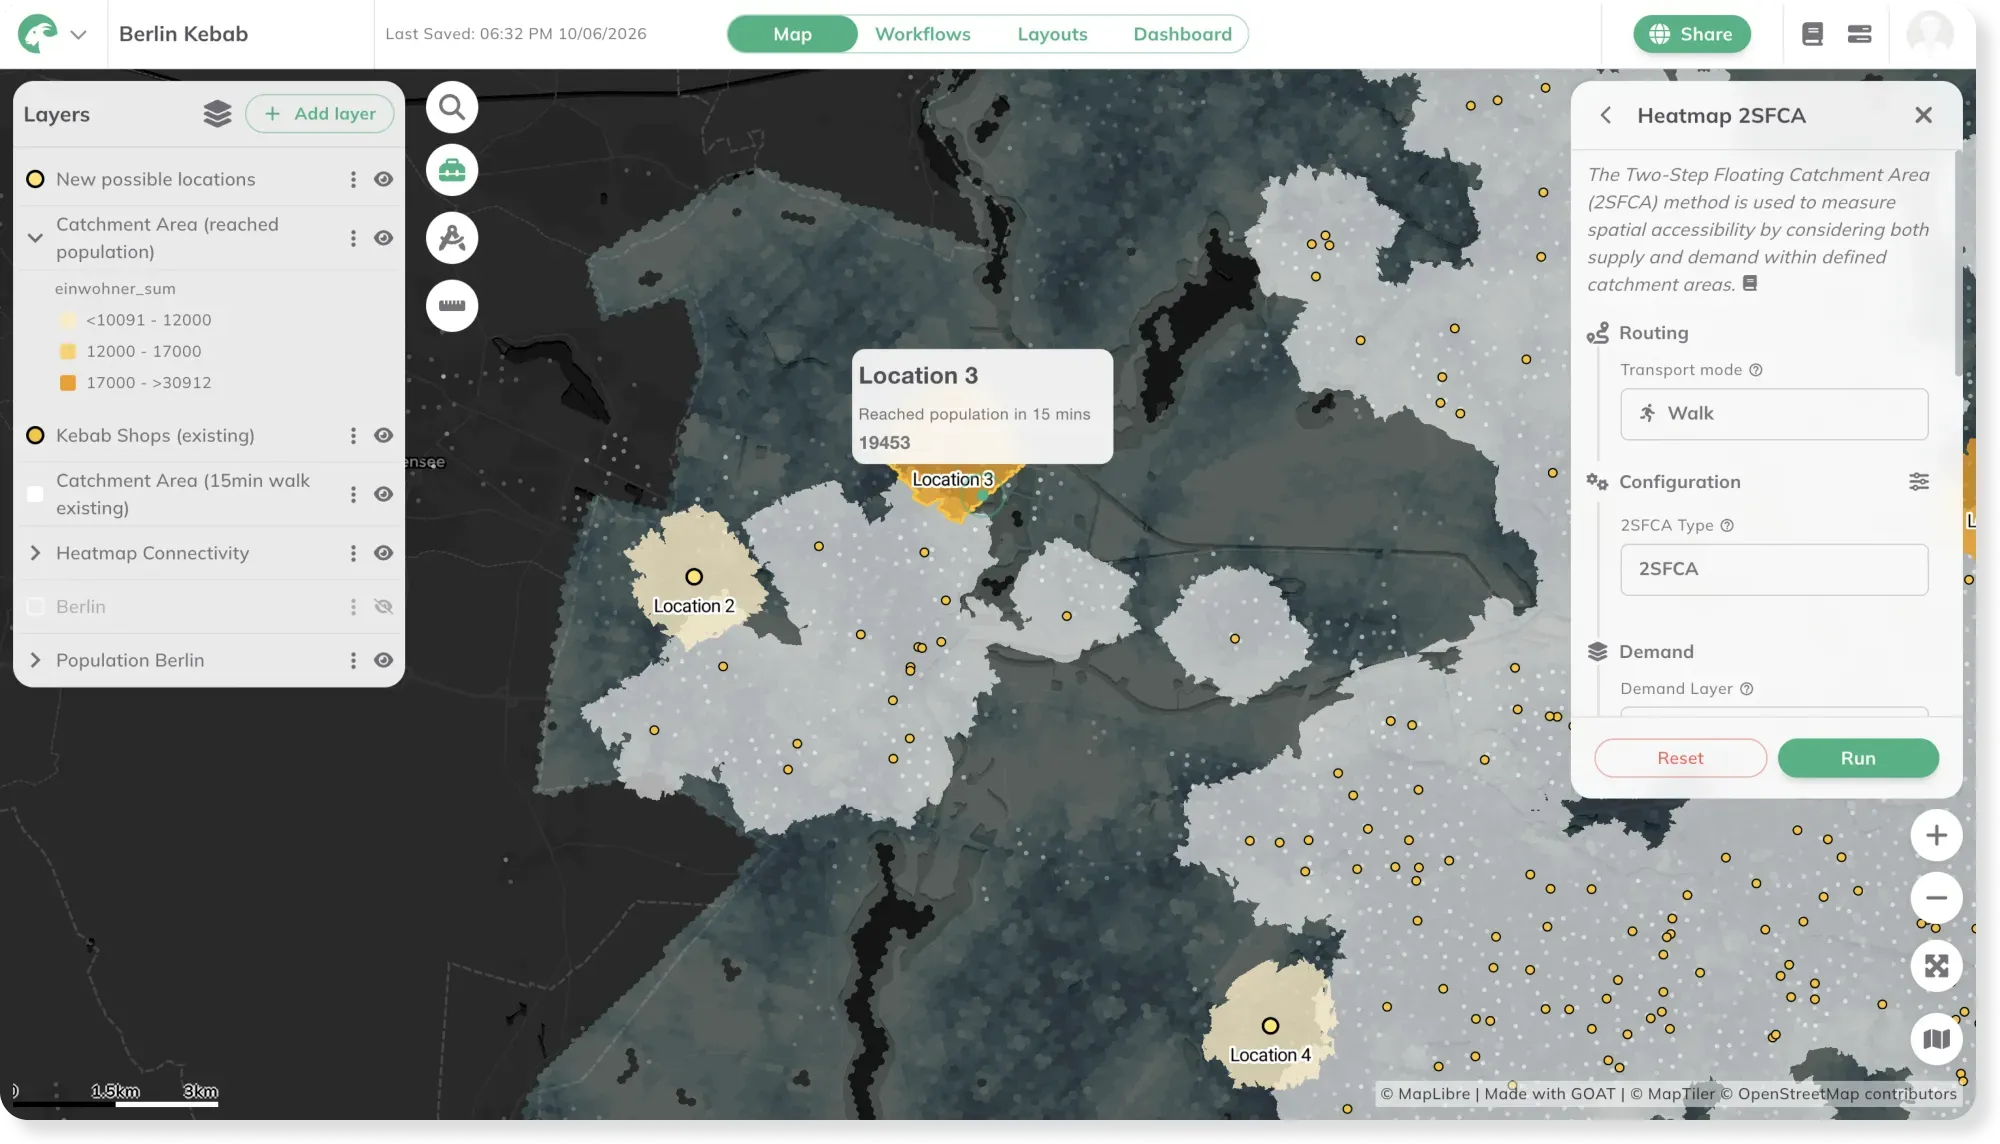
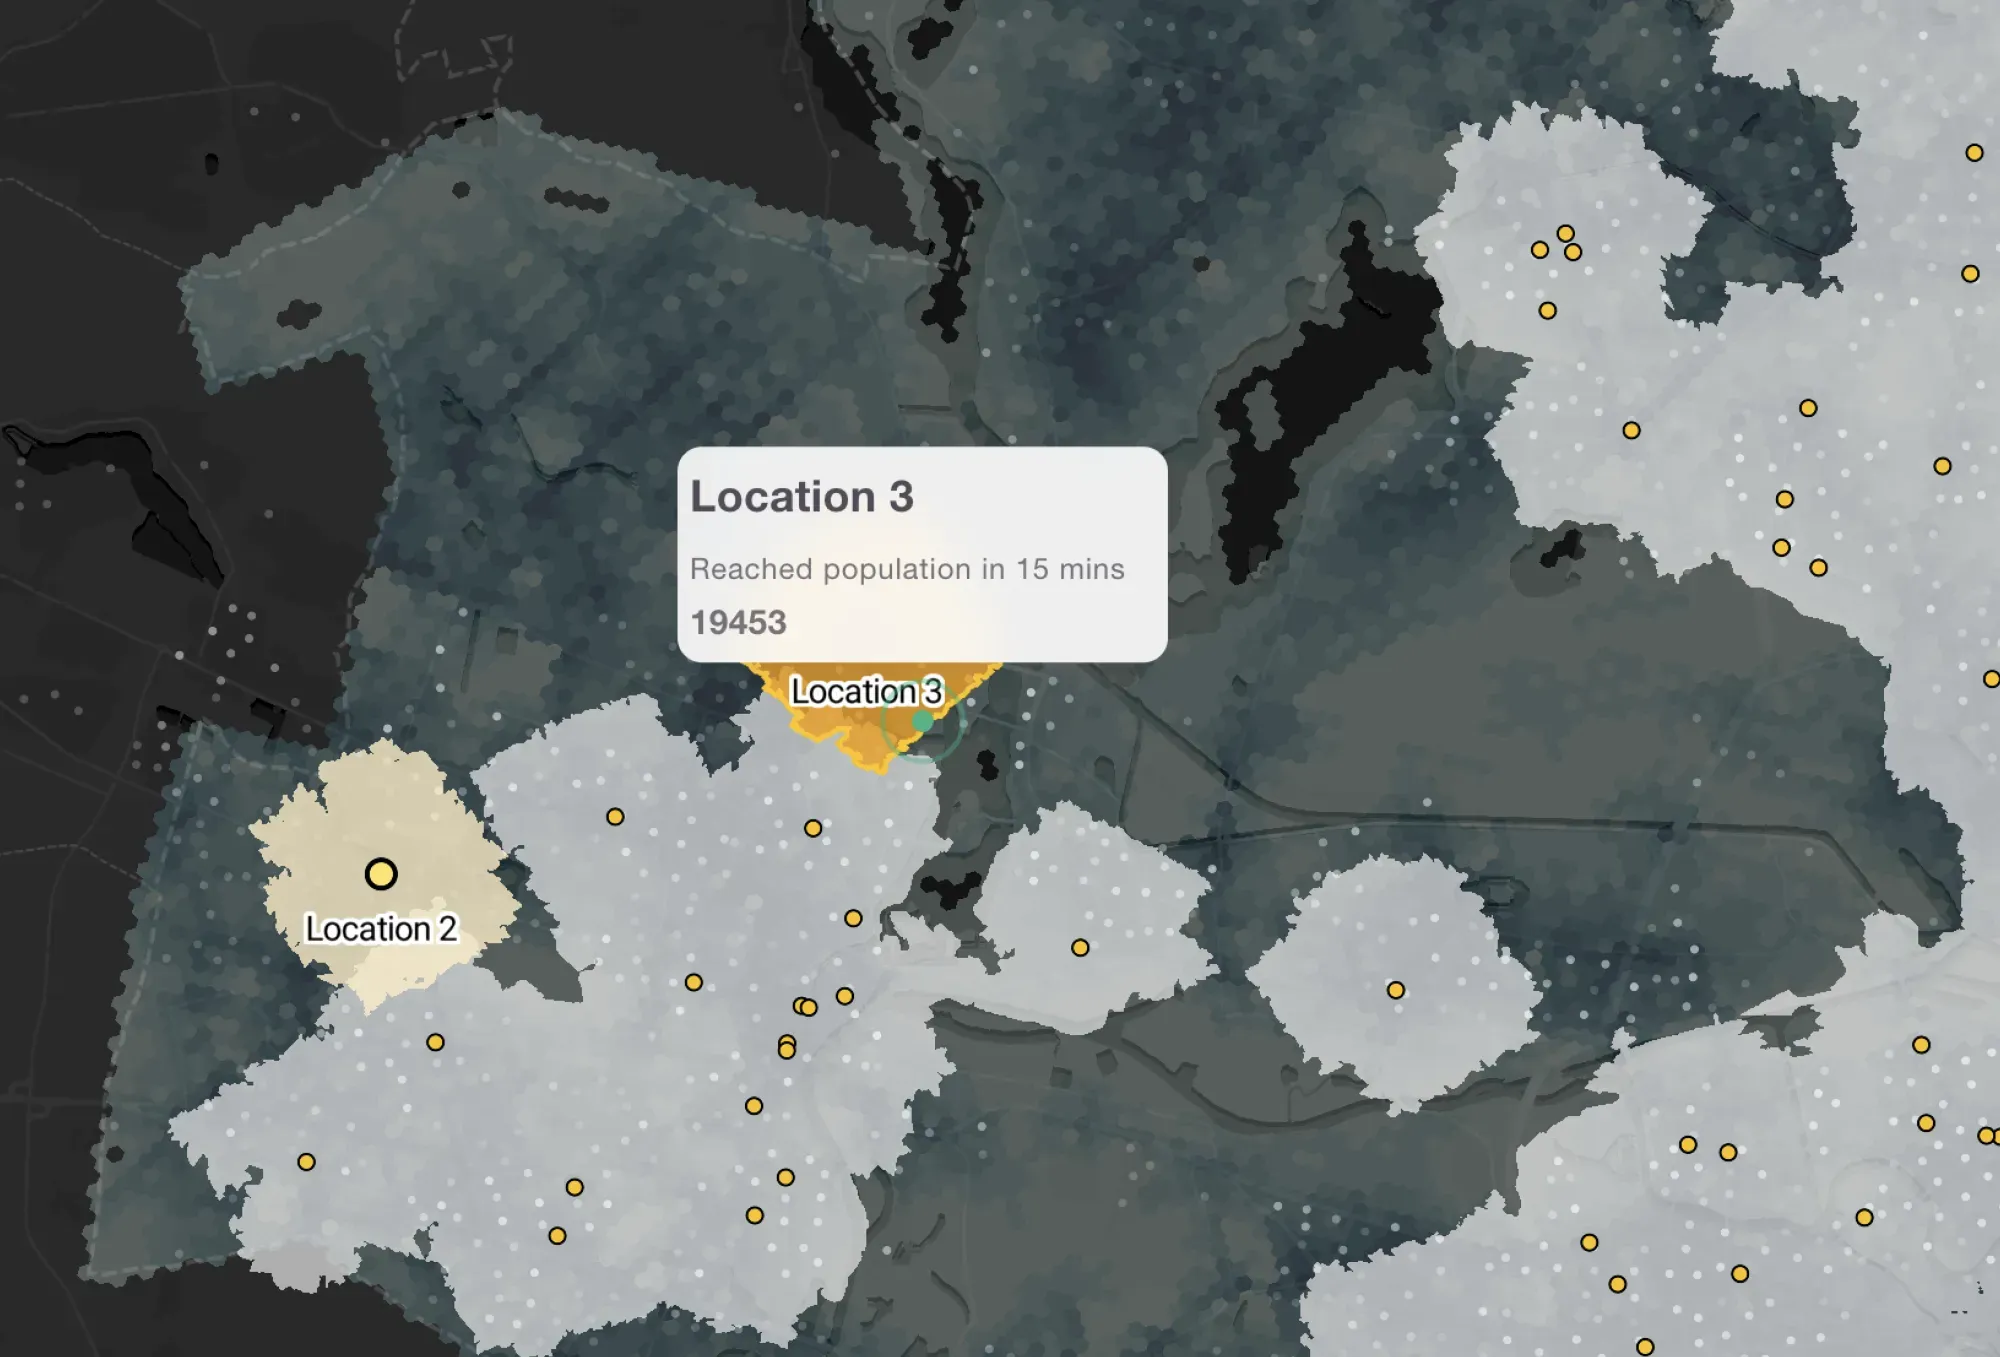
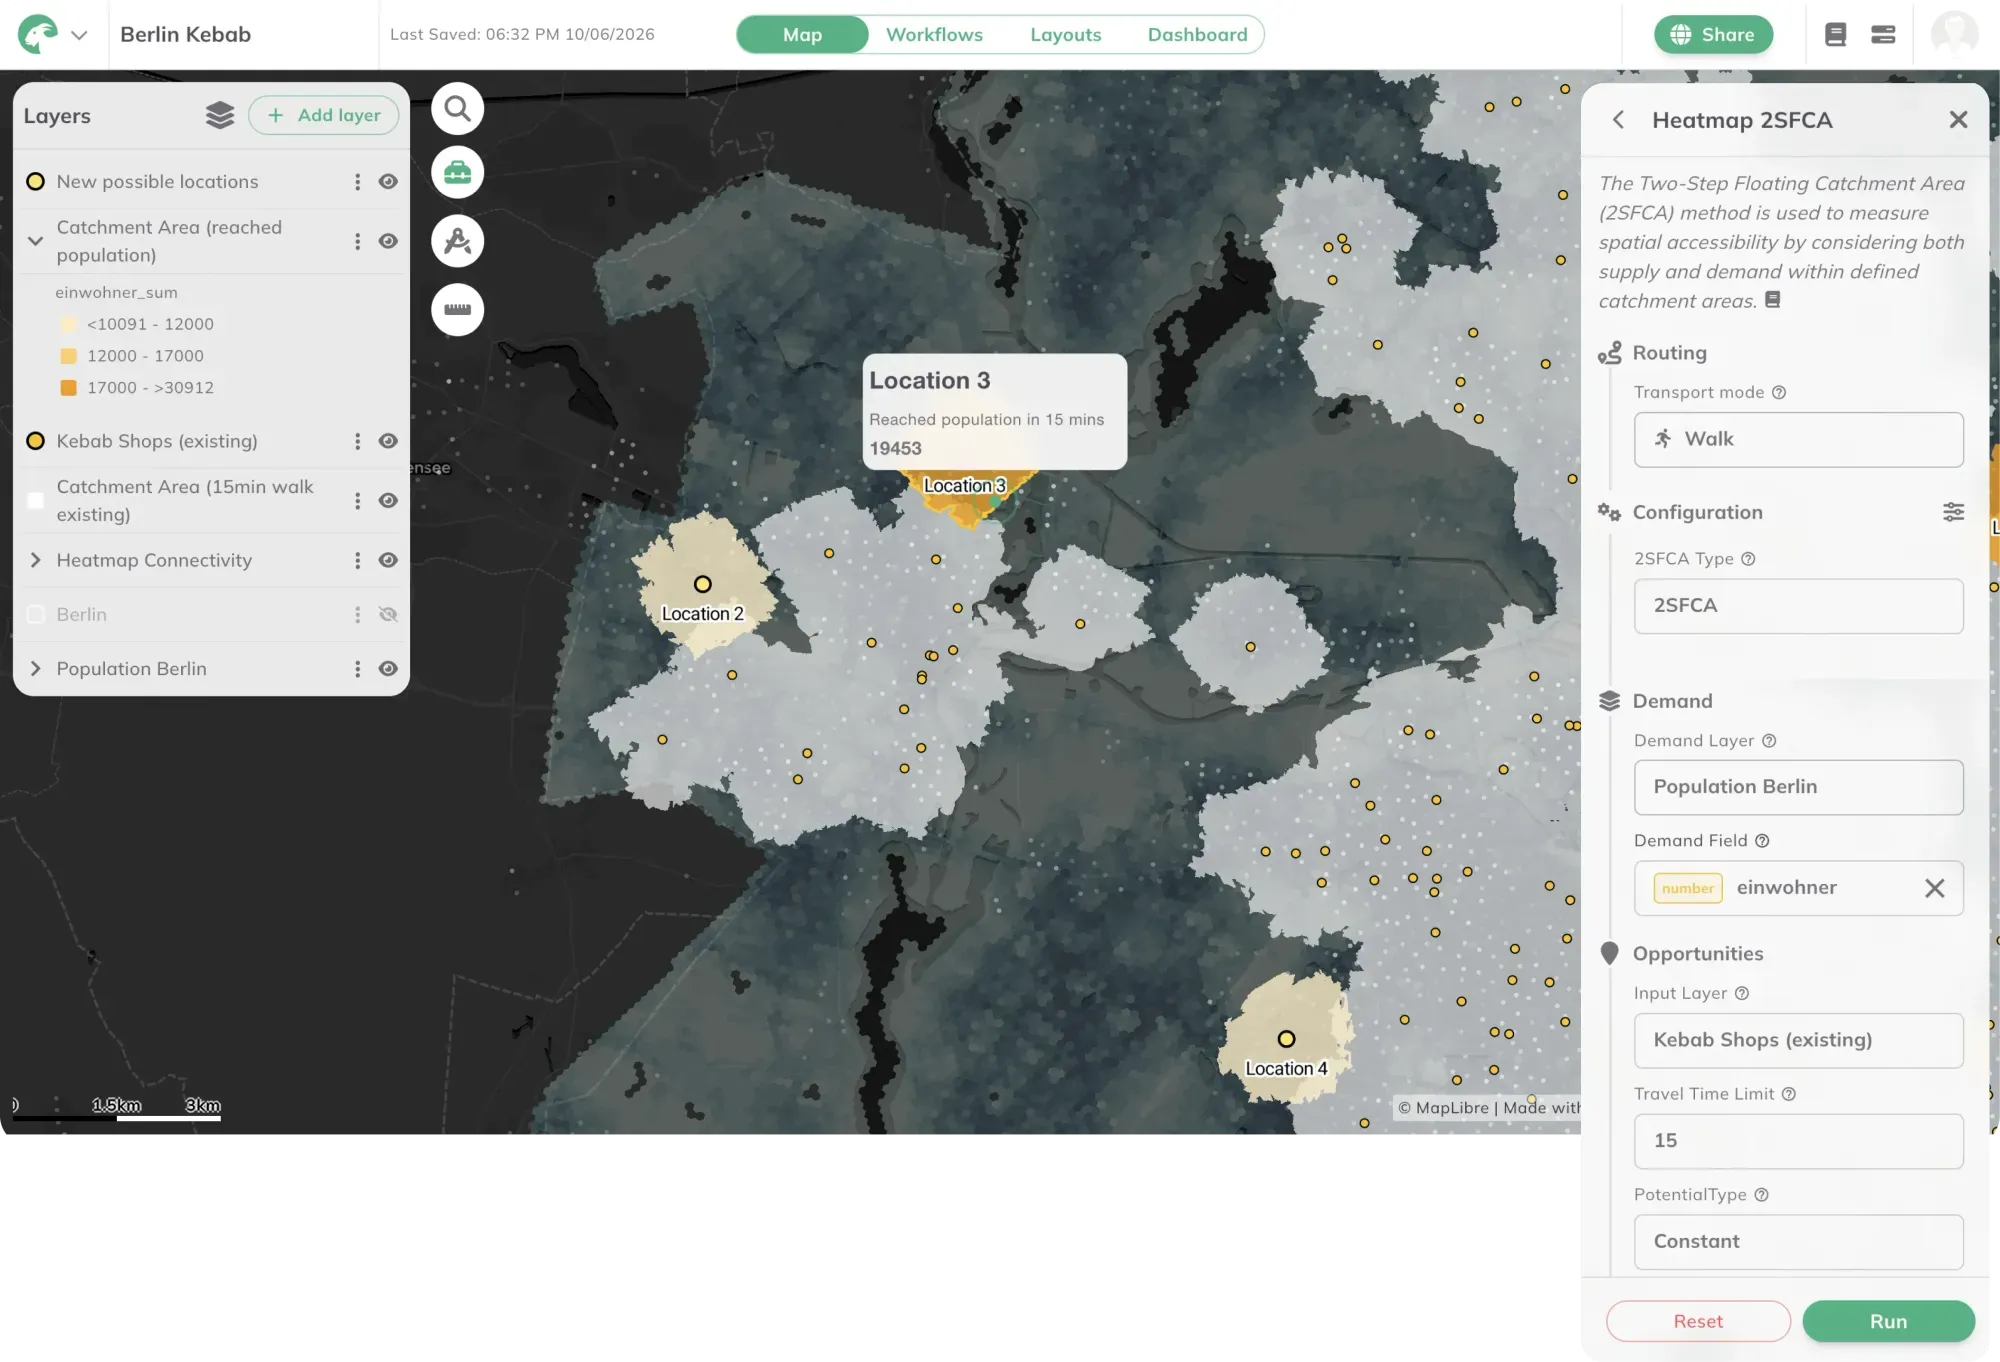
Evaluate the spatial suitability of potential retail locations based on population density, purchasing power, demographic structure, and multimodal accessibility. GOAT's isochrone and travel time tools calculate how many people can reach a given site on foot, by bicycle, or by public transport — providing a robust, comparable basis for investment decisions and branch network planning.
Retail desert and local supply gap analysis in GOAT

Pinpoint Retail Deserts with Accessibility Indicators

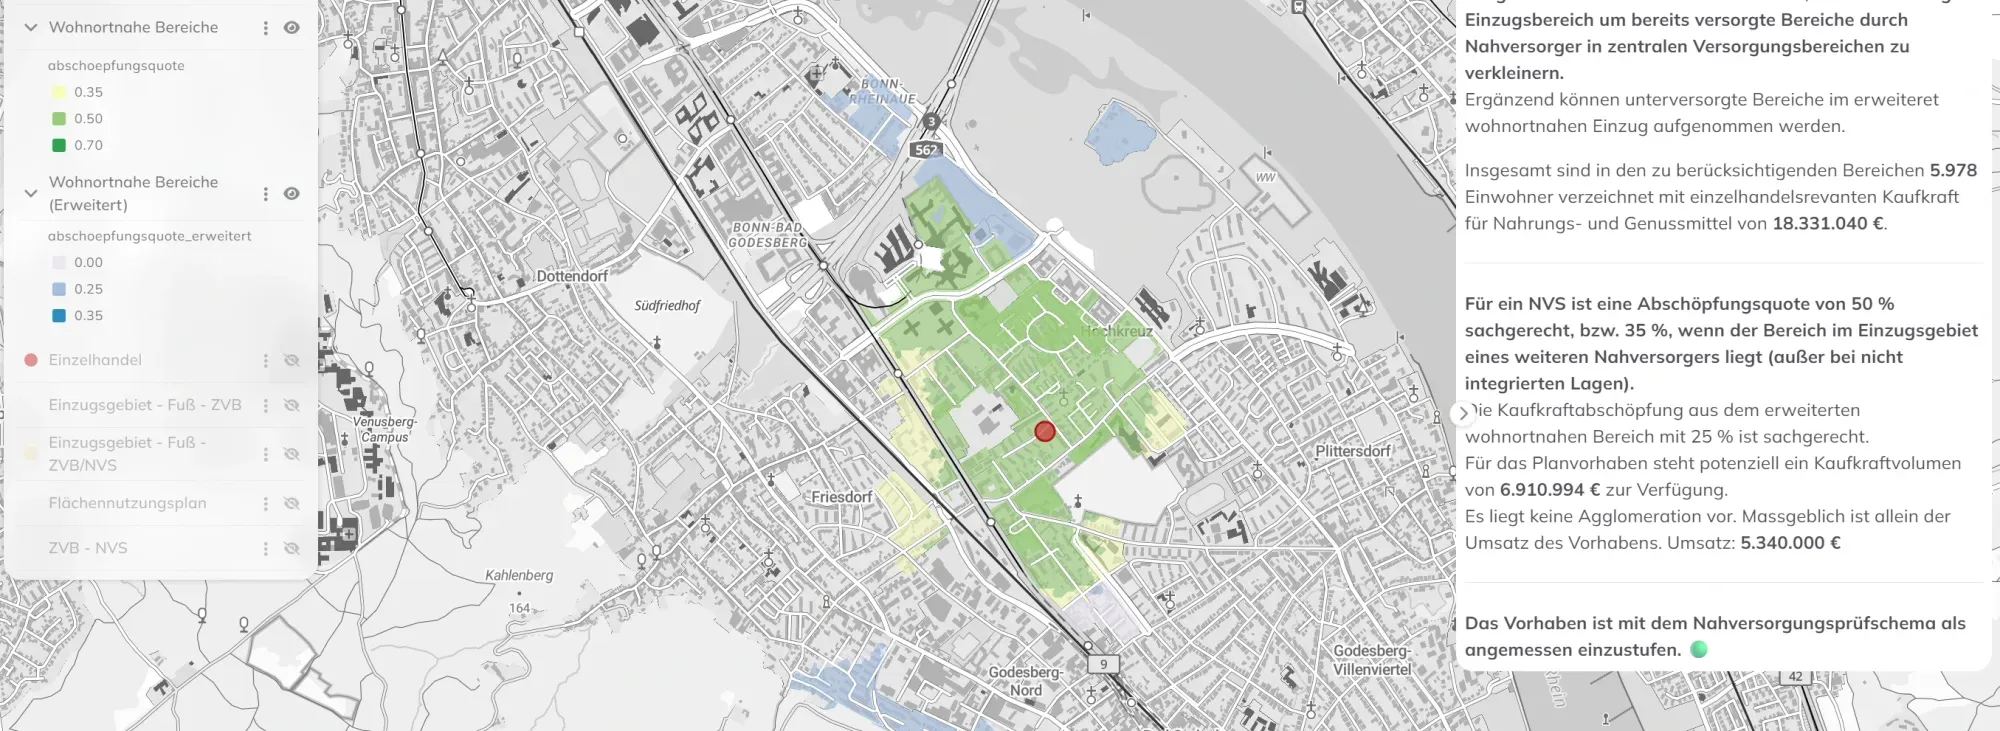
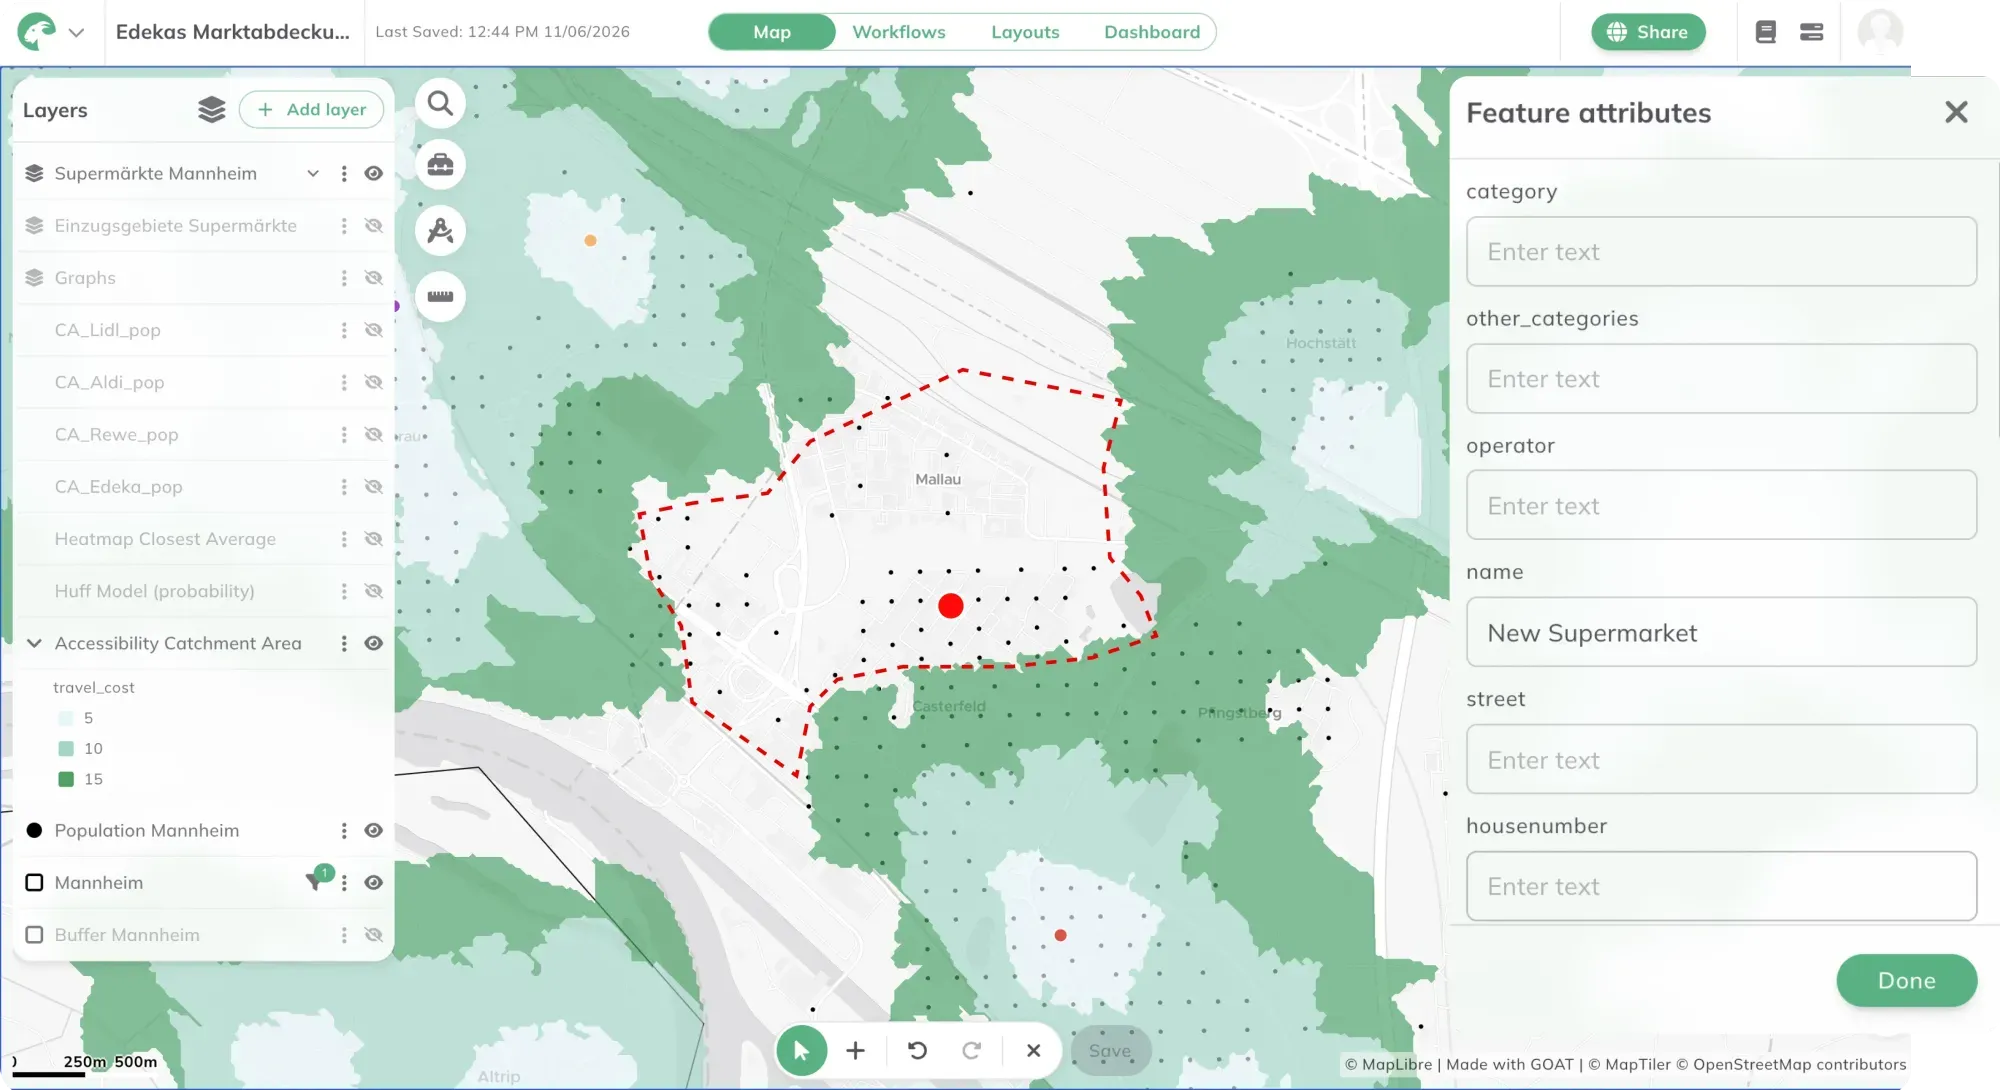
Identify areas where residents have poor access to essential retail — particularly food retail and everyday goods — by overlaying accessibility indicators with population and land use data. GOAT makes it possible to pinpoint retail deserts and prioritise locations for new supply, supporting both private investment decisions and municipal retail development strategies — as demonstrated in Plan4Better's retail planning project for the City of Bonn.

Competitor distribution and market coverage analysis in GOAT

Visualise Market Coverage & Competitor Distribution

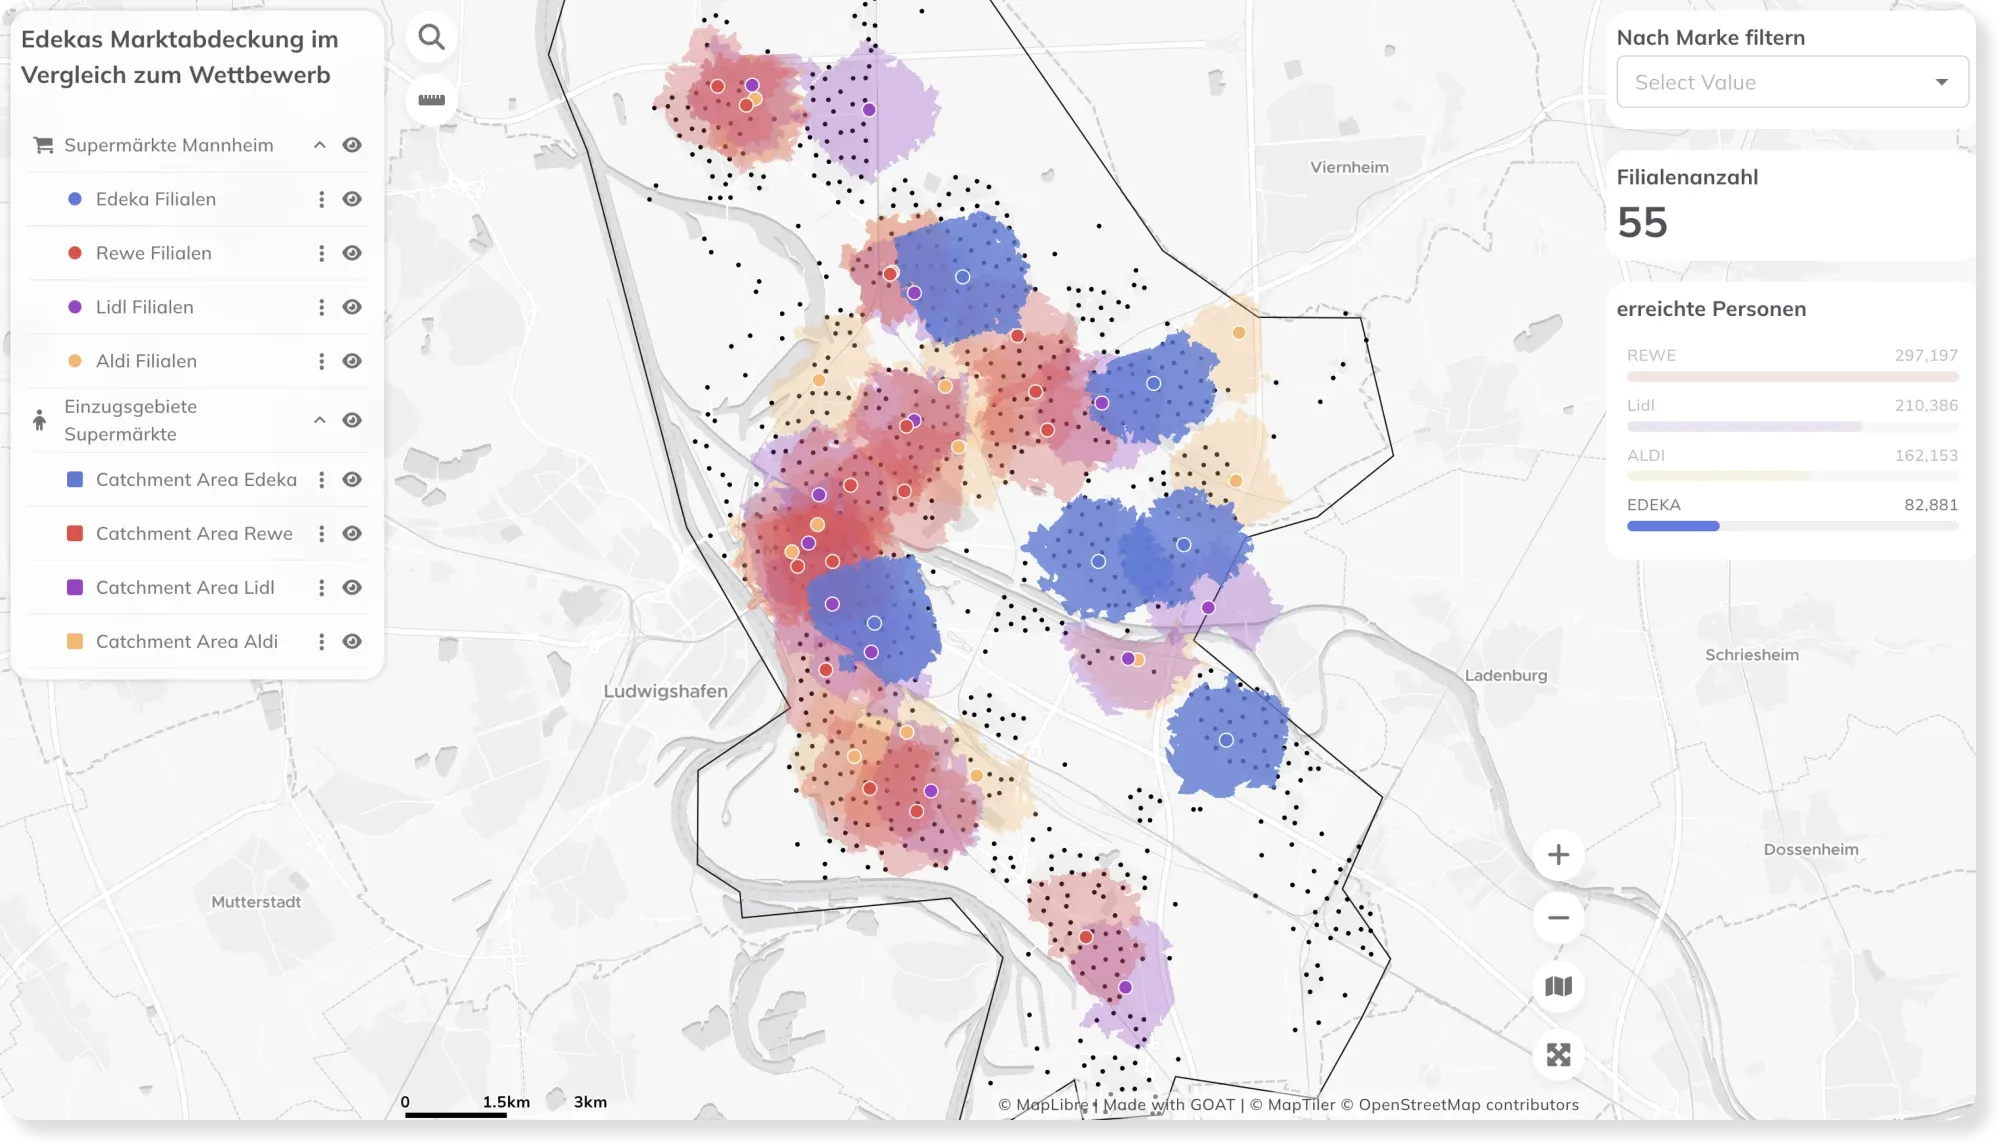
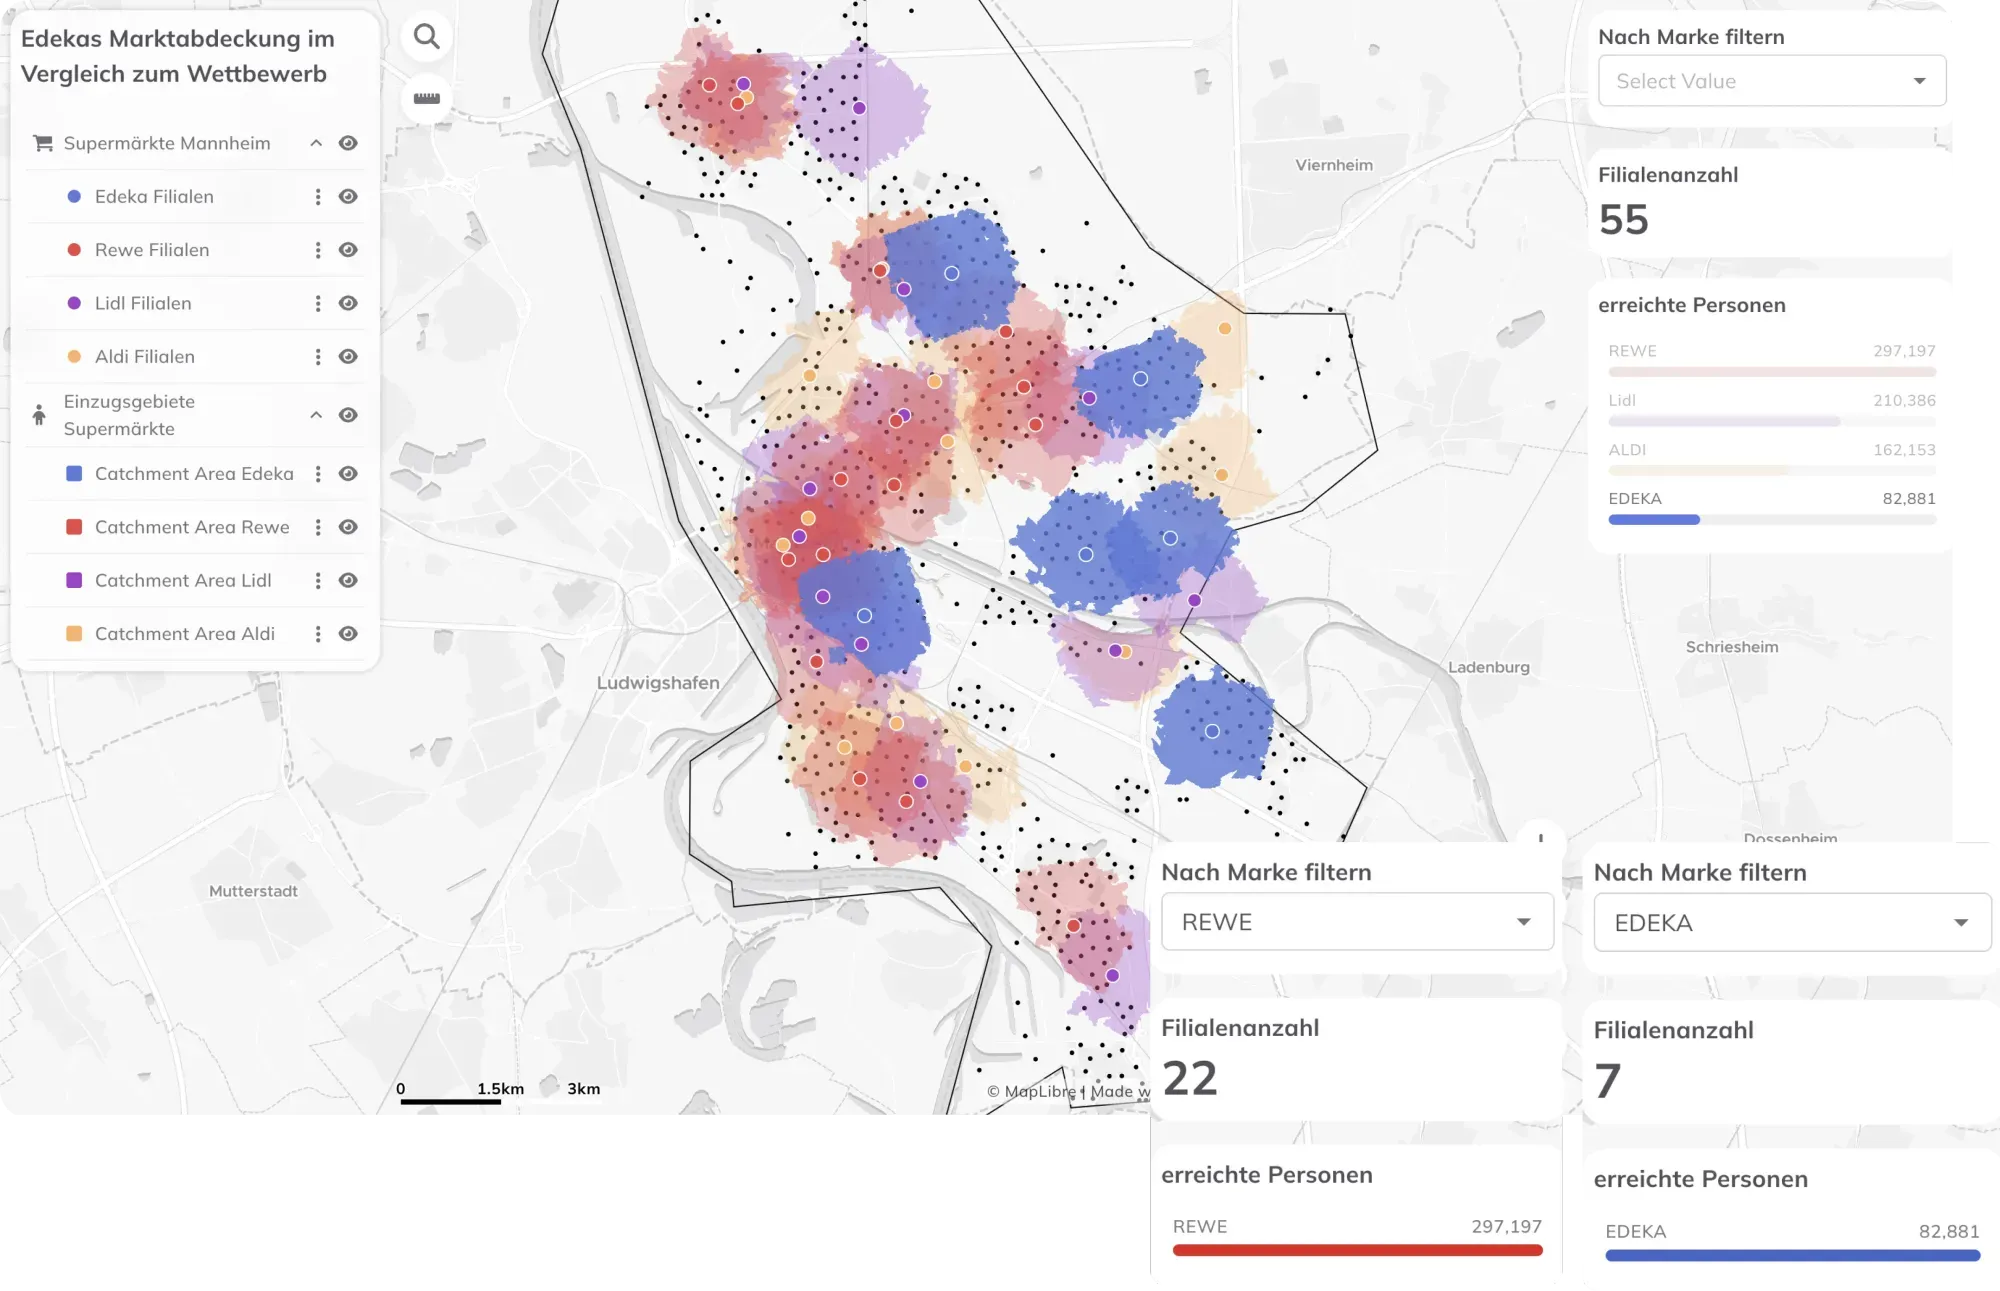
Visualise the spatial distribution of competing retail locations and assess market coverage across a region. By combining accessibility analyses with demographic and purchasing power data, GOAT provides a spatially differentiated picture of market potential — supporting strategic decisions about where to open, relocate, or consolidate retail locations.

Maps made with GOAT

Real analyses built by planners, researchers, and cities — explore what’s possible before you start your own.

  • Branch Network Planning: Market Coverage and Site Selection

    Branch Network Planning: Market Coverage and Site Selection

    How much of the market does your branch network reach — and where's the gap for a new store? This map compares locations by catchment, competition, and population reached.

    Check the map
  • Retail Site Selection: Where Should the Next Shop Open?

    Retail Site Selection: Where Should the Next Shop Open?

    Where's the gap in the market for a new shop? This map ranks potential sites by how many people can reach them on foot, and where demand goes unmet.

    Check the map
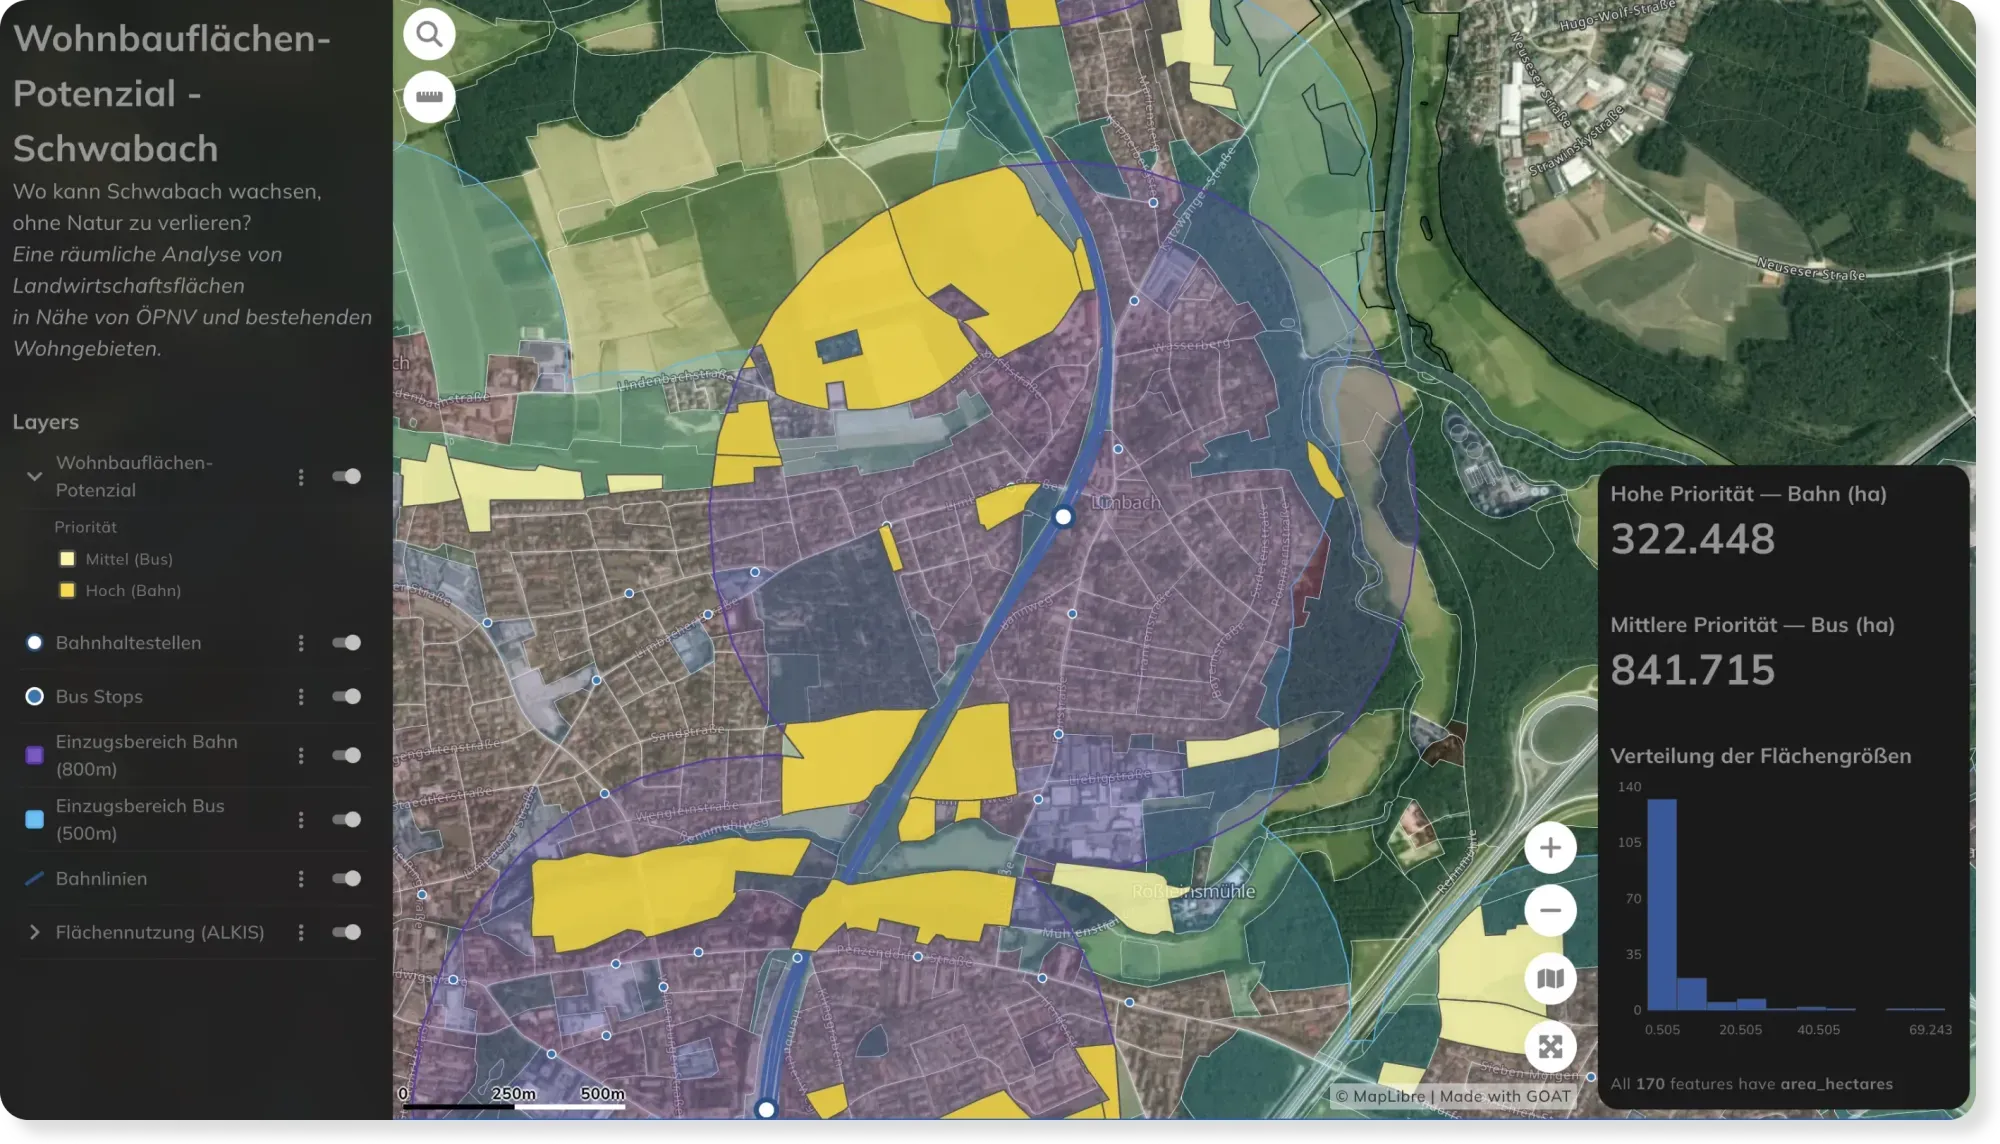
  • Land Use & Development Potential in Schwabach

    Land Use & Development Potential in Schwabach

    See how land is used across Schwabach — and where there's room to grow. An open land-use map for planners, developers, and citizens.

    Check the map

The difference

Why GOAT?

  • Planning indicators and GIS tools, ready and easy to use

    Huff models and catchment areas by walking, cycling, driving and public transport, for any location: the indicators your location decisions rely on, ready to run with your parameters. Around them sits a full toolbox of GIS and data analysis tools, so you can join, filter and aggregate your own data without leaving the browser.

    Then save the whole thing as a workflow. When the data updates or a boundary changes, run it again. Same method, new result, no rebuilding.

  • A data catalog with AI-powered search

    Over 20,000 ready-to-use datasets: population, purchasing-relevant demographics, points of interest, street networks. Describe what you need and the catalog finds it, so you can start the analysis instead of procuring data first.

  • Ready to use, open by design

    Nothing to install. Built on open-source technologies and open standards, so your data and workflows stay portable.

  • Scalable

    From a single site check to a whole portfolio, compared on the same basis.

  • Proven in practice

    Used for location assessments, expansion planning and local supply studies.

See how Bonn is doing it

Retail analysis embedded in the city's own Urban Data Platform, not run alongside it.

Retail planning in Bonn: data-driven GIS analysis with the WebGIS GOAT

Retail planning in Bonn: data-driven GIS analysis with the WebGIS GOAT

Plan4Better is developing a GIS-based retail planning tool for the City of Bonn — enabling automated accessibility analyses, local supply assessments, and data-driven decisions fully integrated into the Urban Data Platform.

Read the reference

Planning retail in your own city?

Book a slot and we'll look at your catchment areas and local supply together.

  • Catchment areas by walking, cycling, driving and public transport, for existing sites and candidates.
  • Local supply gaps — where residents have no shop within reach.
  • Overlap between your own locations.
  • Map-based site reports for expansion decisions and landlord conversations.

Ready to make sense of your data?

Join planners, organizations and cities using GOAT to make better decisions, faster. No GIS expertise needed.