Plan4Better

Industries

Mobility Planning

Mobility planning challenges are fundamentally spatial — from assessing public transport quality to identifying cycling infrastructure gaps. GOAT brings together GTFS timetable data, traffic flow data, and sociodemographic information in one browser-based platform, enabling transport planners to move from raw data to decision-ready insights without GIS expertise.

GOAT mobility planning dashboards for transport analysis
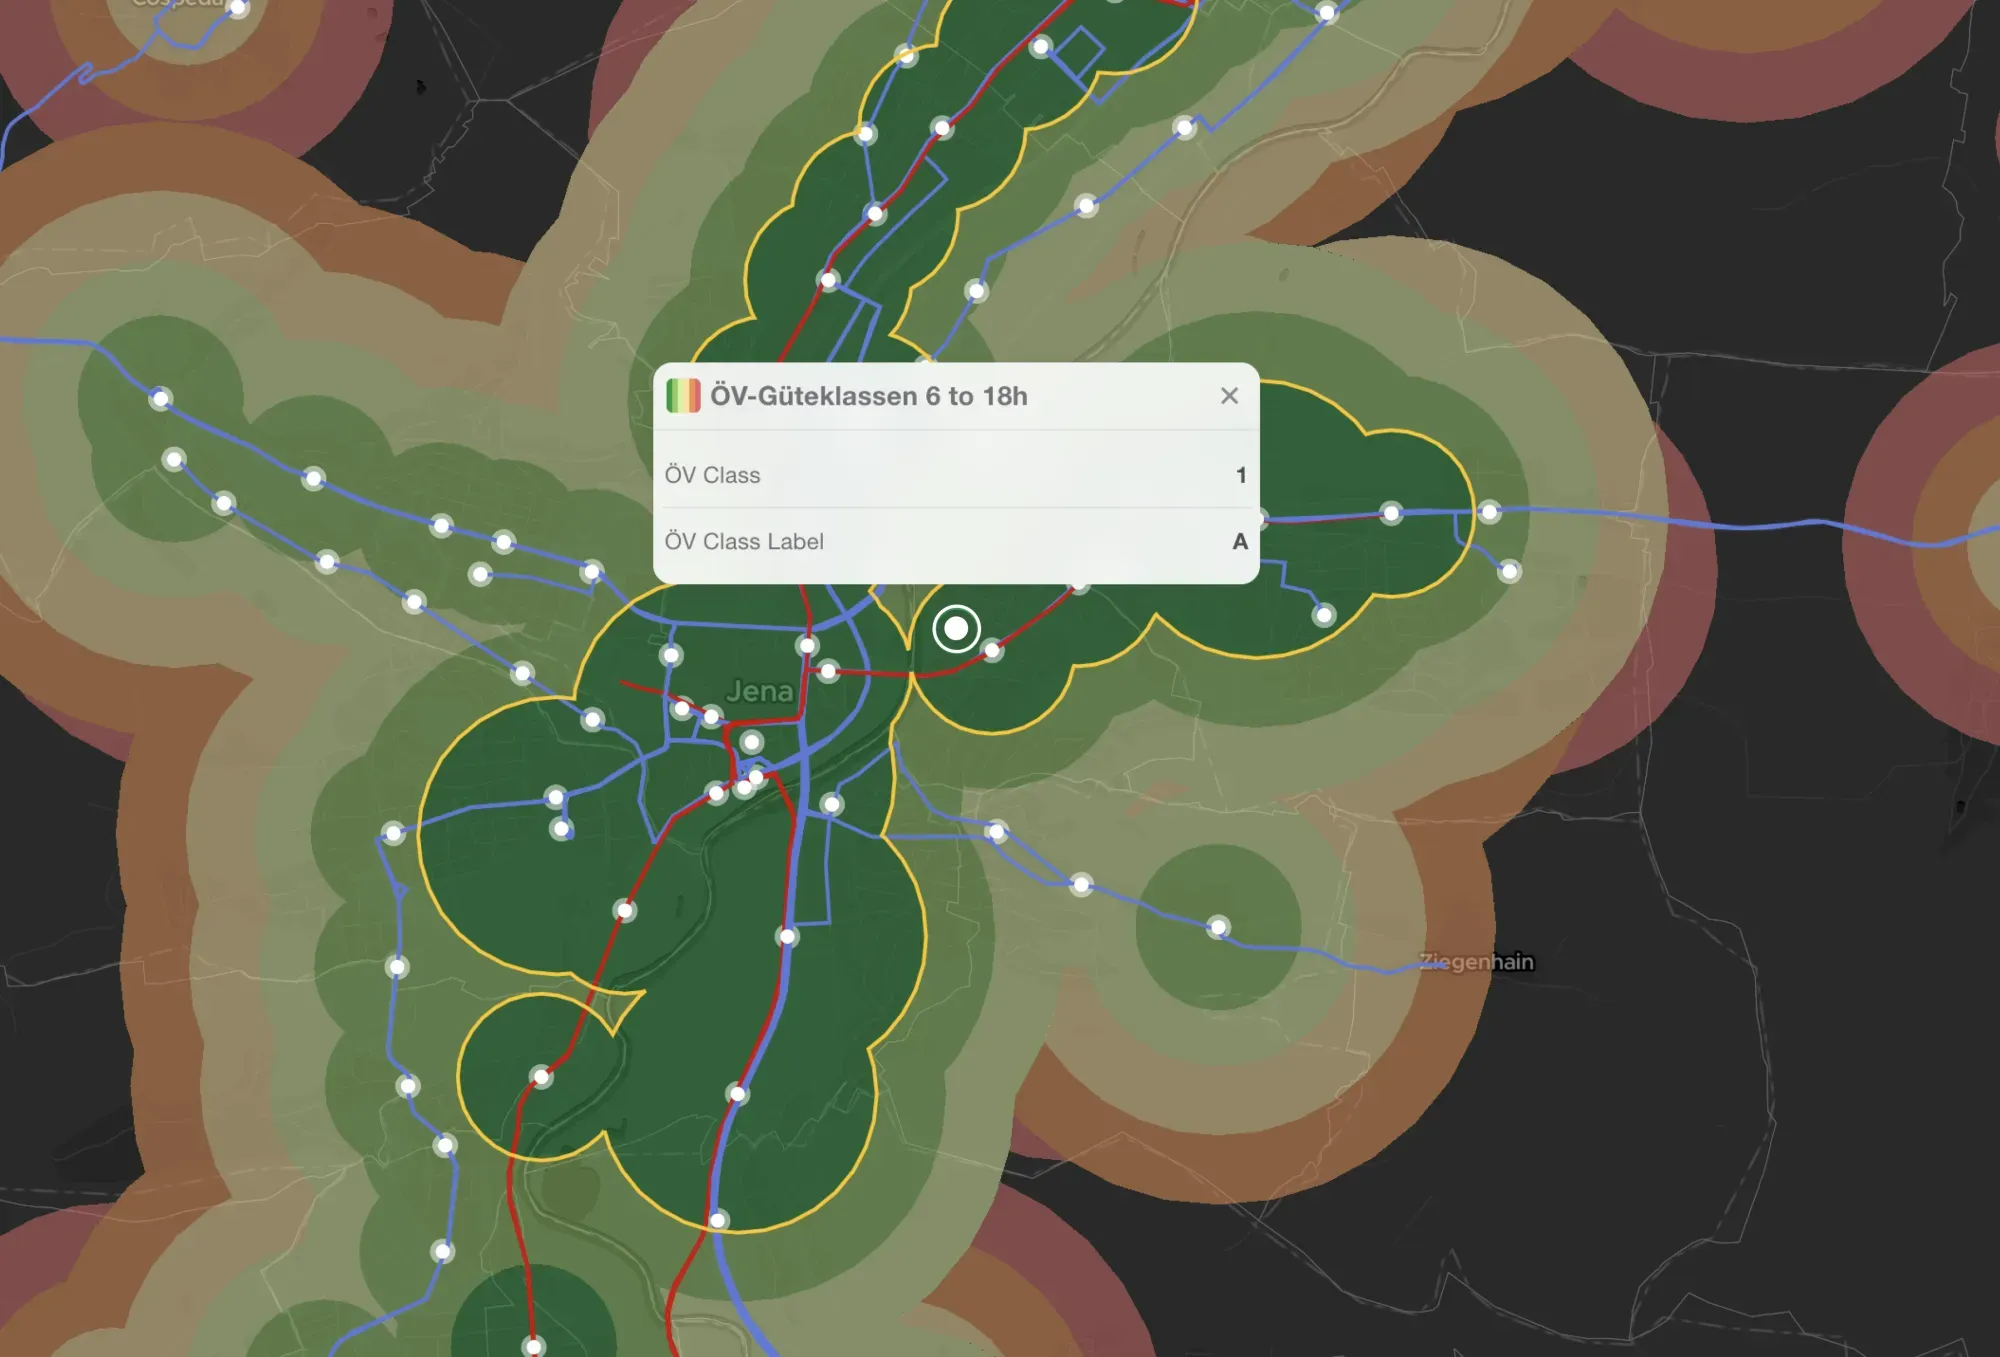
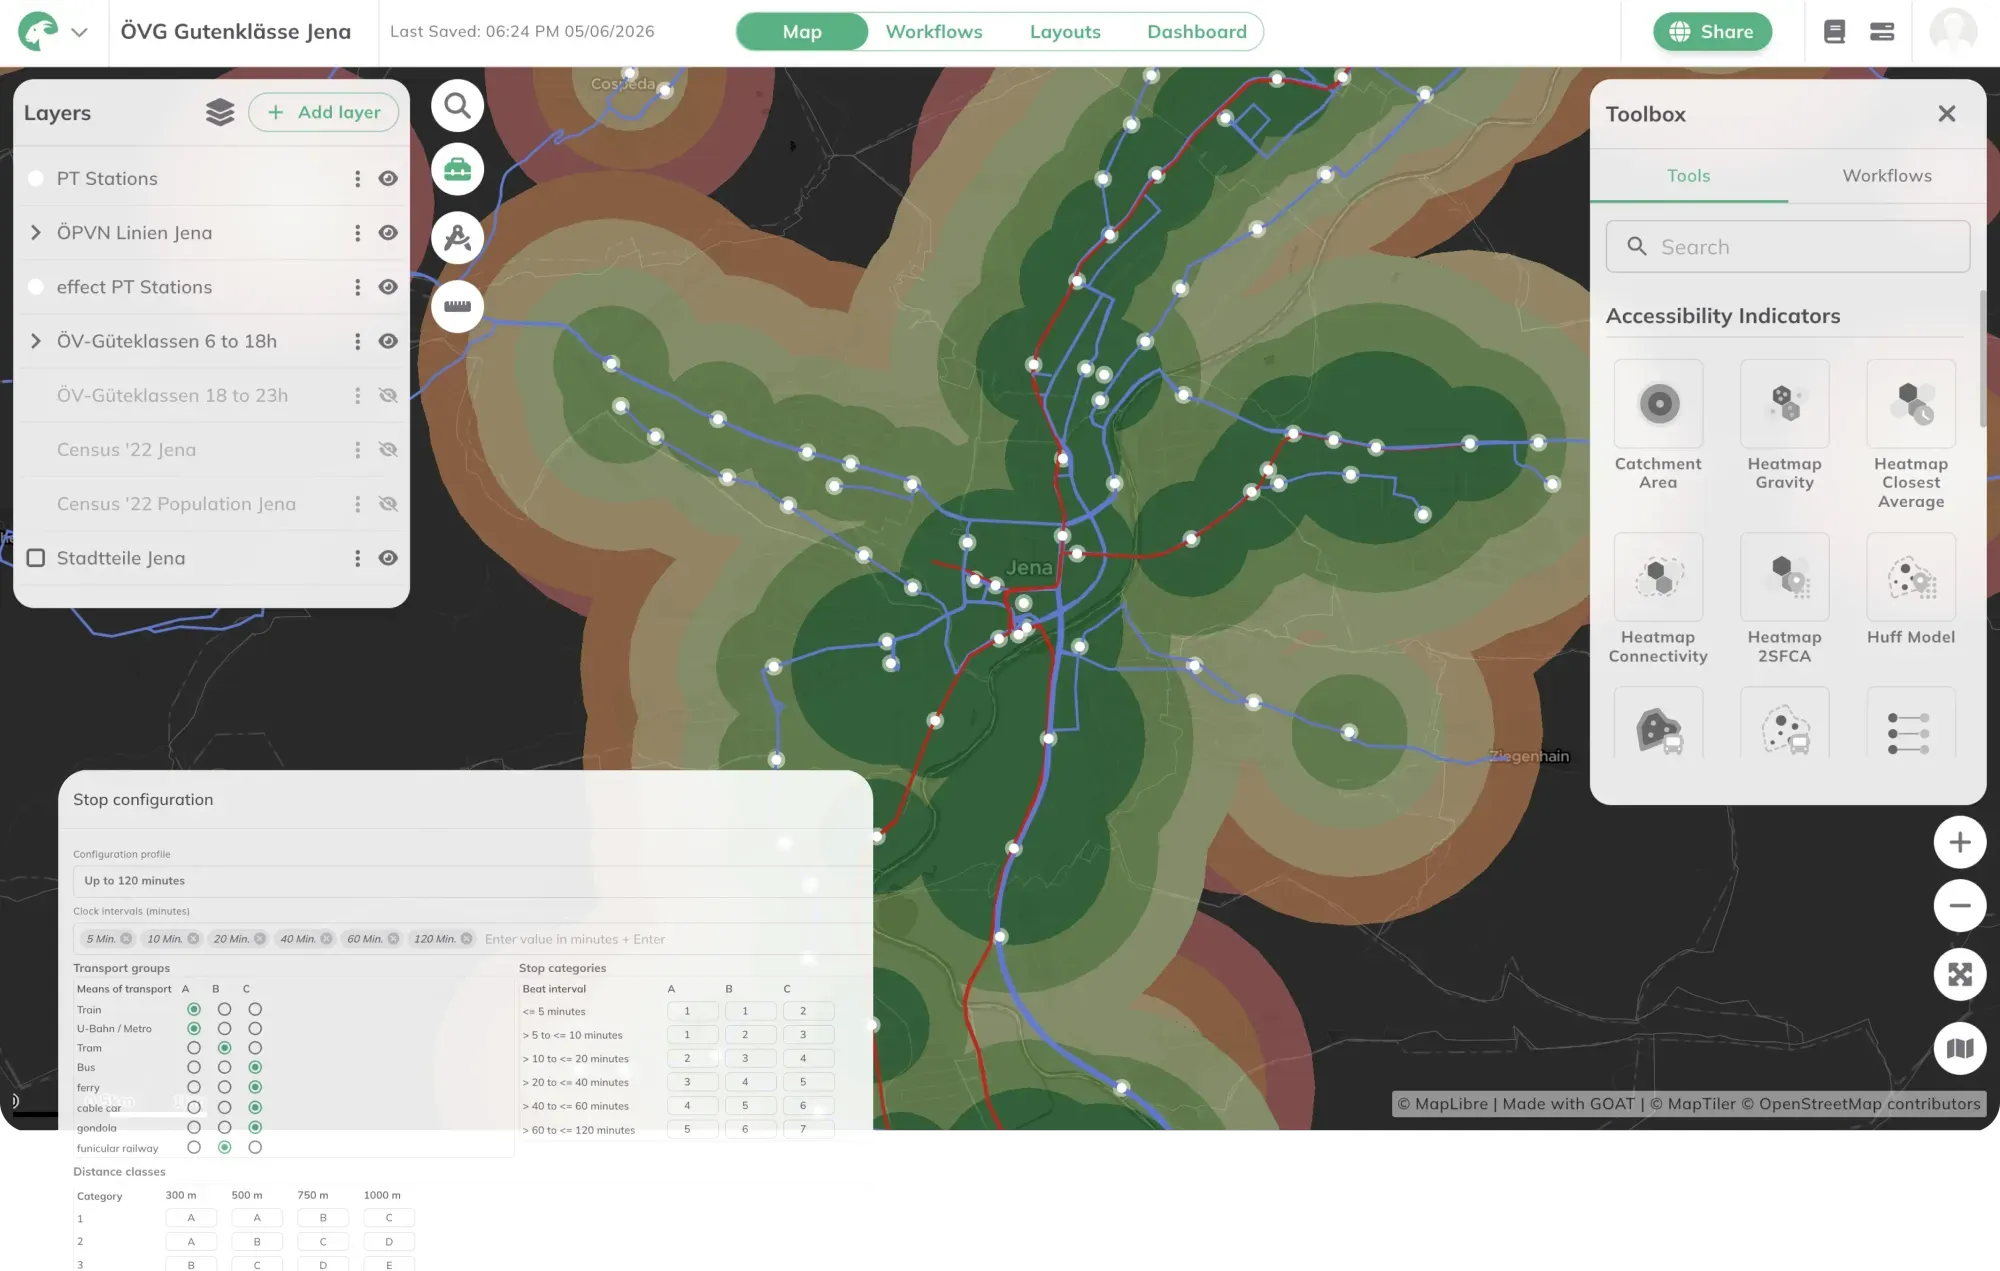
Public transport quality classes (ÖV-Güteklassen) analysis in GOAT

Assess & Benchmark Public Transport Quality

Calculate public transport quality classes (ÖV-Güteklassen) based on real timetable data to assess service levels at stop and municipality level. Identify underserved areas, benchmark against regional or national standards, and build a data-driven case for network improvements — including the integration of on-demand services alongside classical scheduled transit.
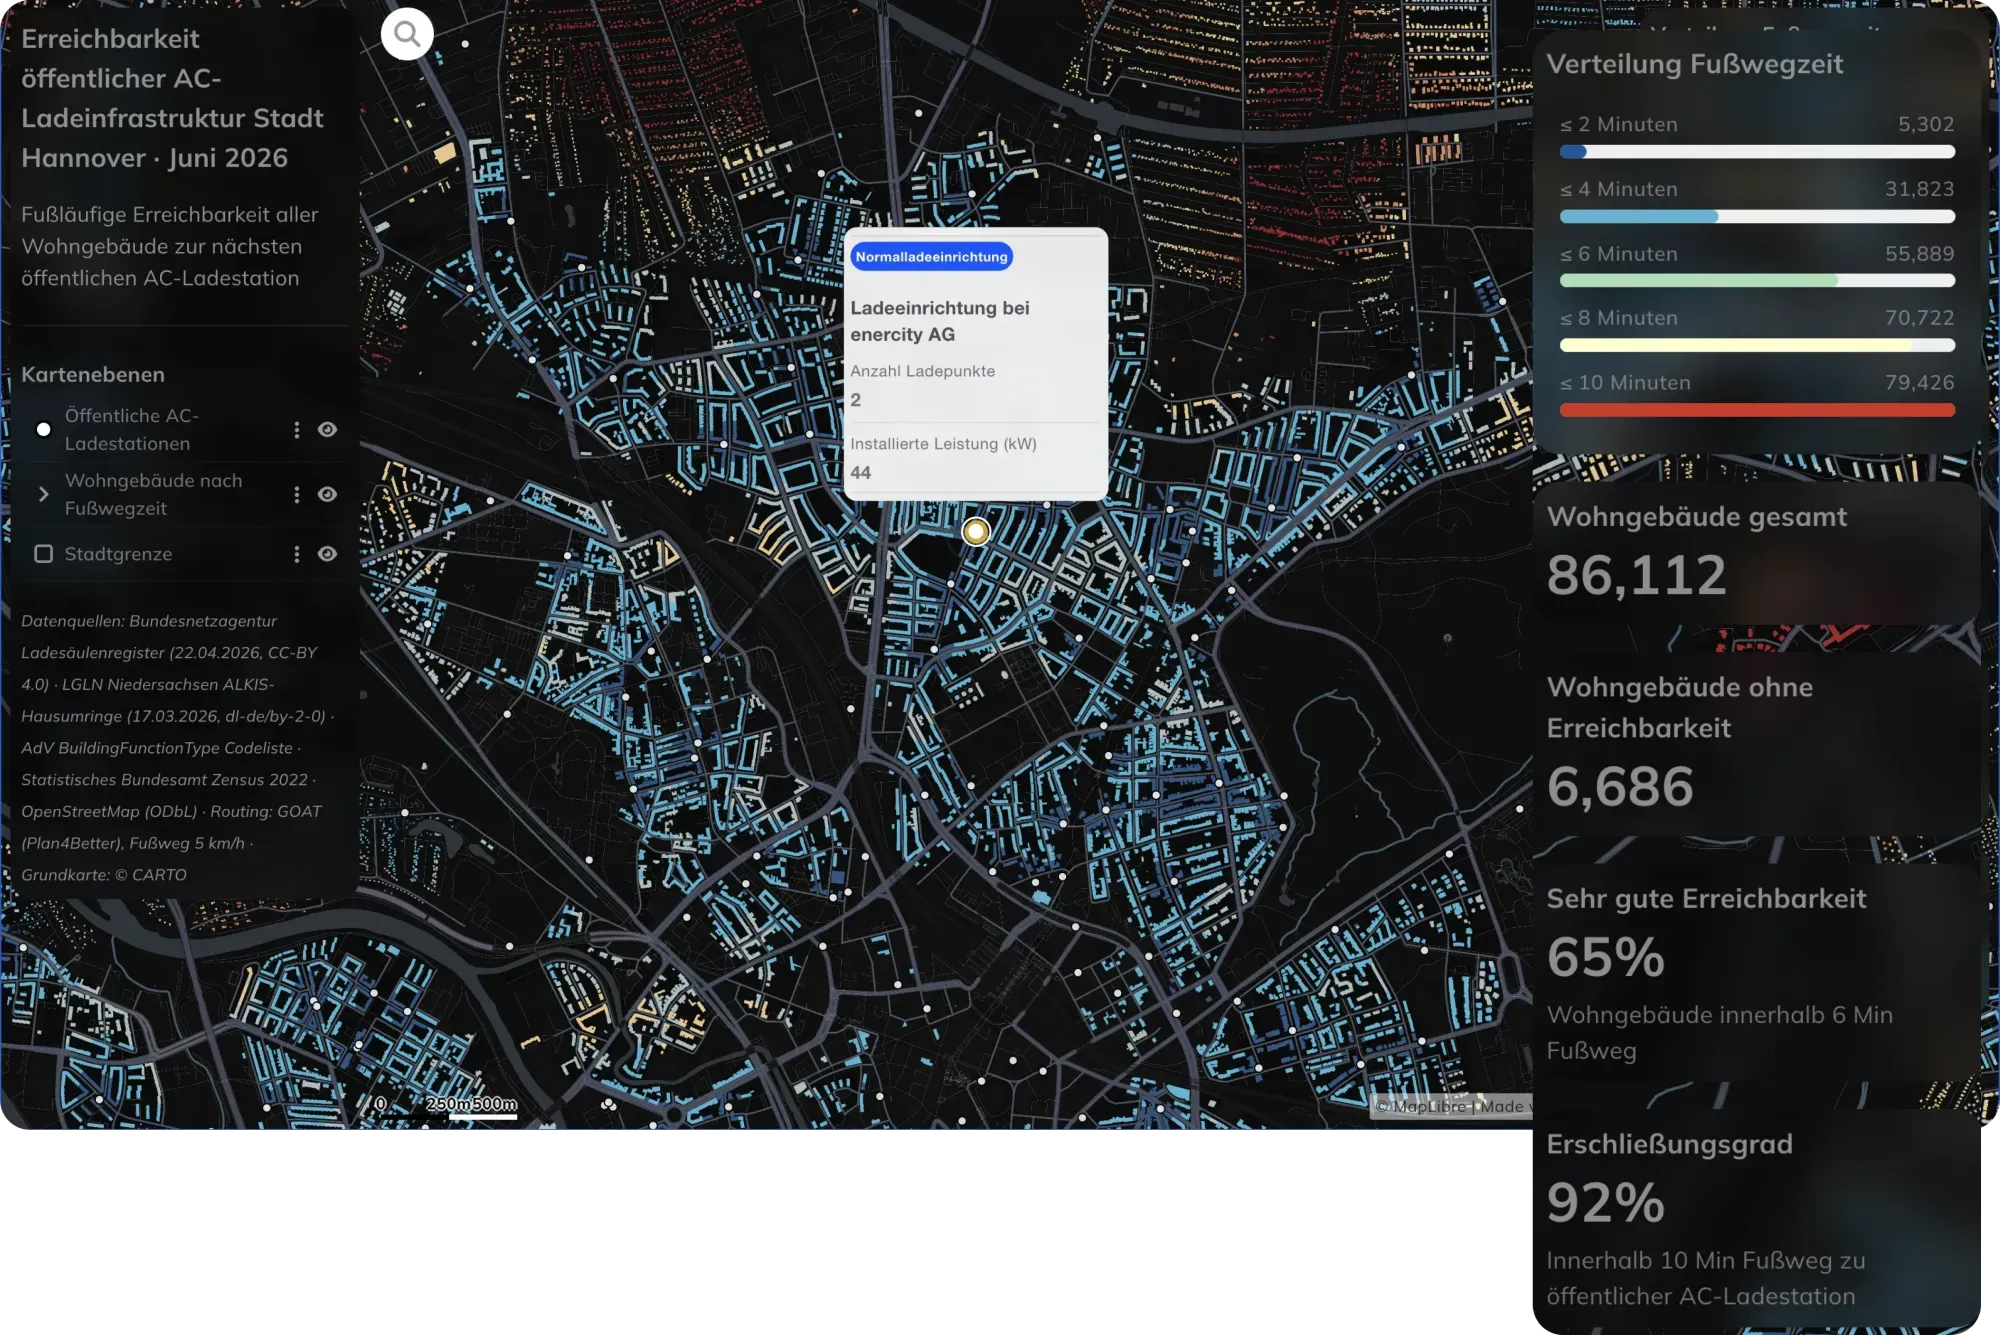
Walking and cycling network gap analysis in GOAT

Identify Gaps in Walking, Cycling & Transit Access

Evaluate how well residents can reach essential destinations — schools, healthcare facilities, workplaces, retail, and public transport stops — by foot or by bicycle. GOAT's isochrone and heatmap tools make it easy to identify gaps in the active mobility network and prioritise infrastructure investments where they matter most.

Catchment analysis for shared mobility service locations in GOAT

Find the Best Locations for Shared Mobility Services

Assess the spatial suitability of locations for bike sharing, e-cargo bike stations, car sharing, and other shared mobility services. GOAT's catchment area and demand analysis tools help identify optimal placement based on population density, land use, and accessibility to key destinations.

Maps made with GOAT

Real analyses built by planners, researchers, and cities — explore what’s possible before you start your own.

  • Transit Accessibility Analysis

    Transit Accessibility Analysis

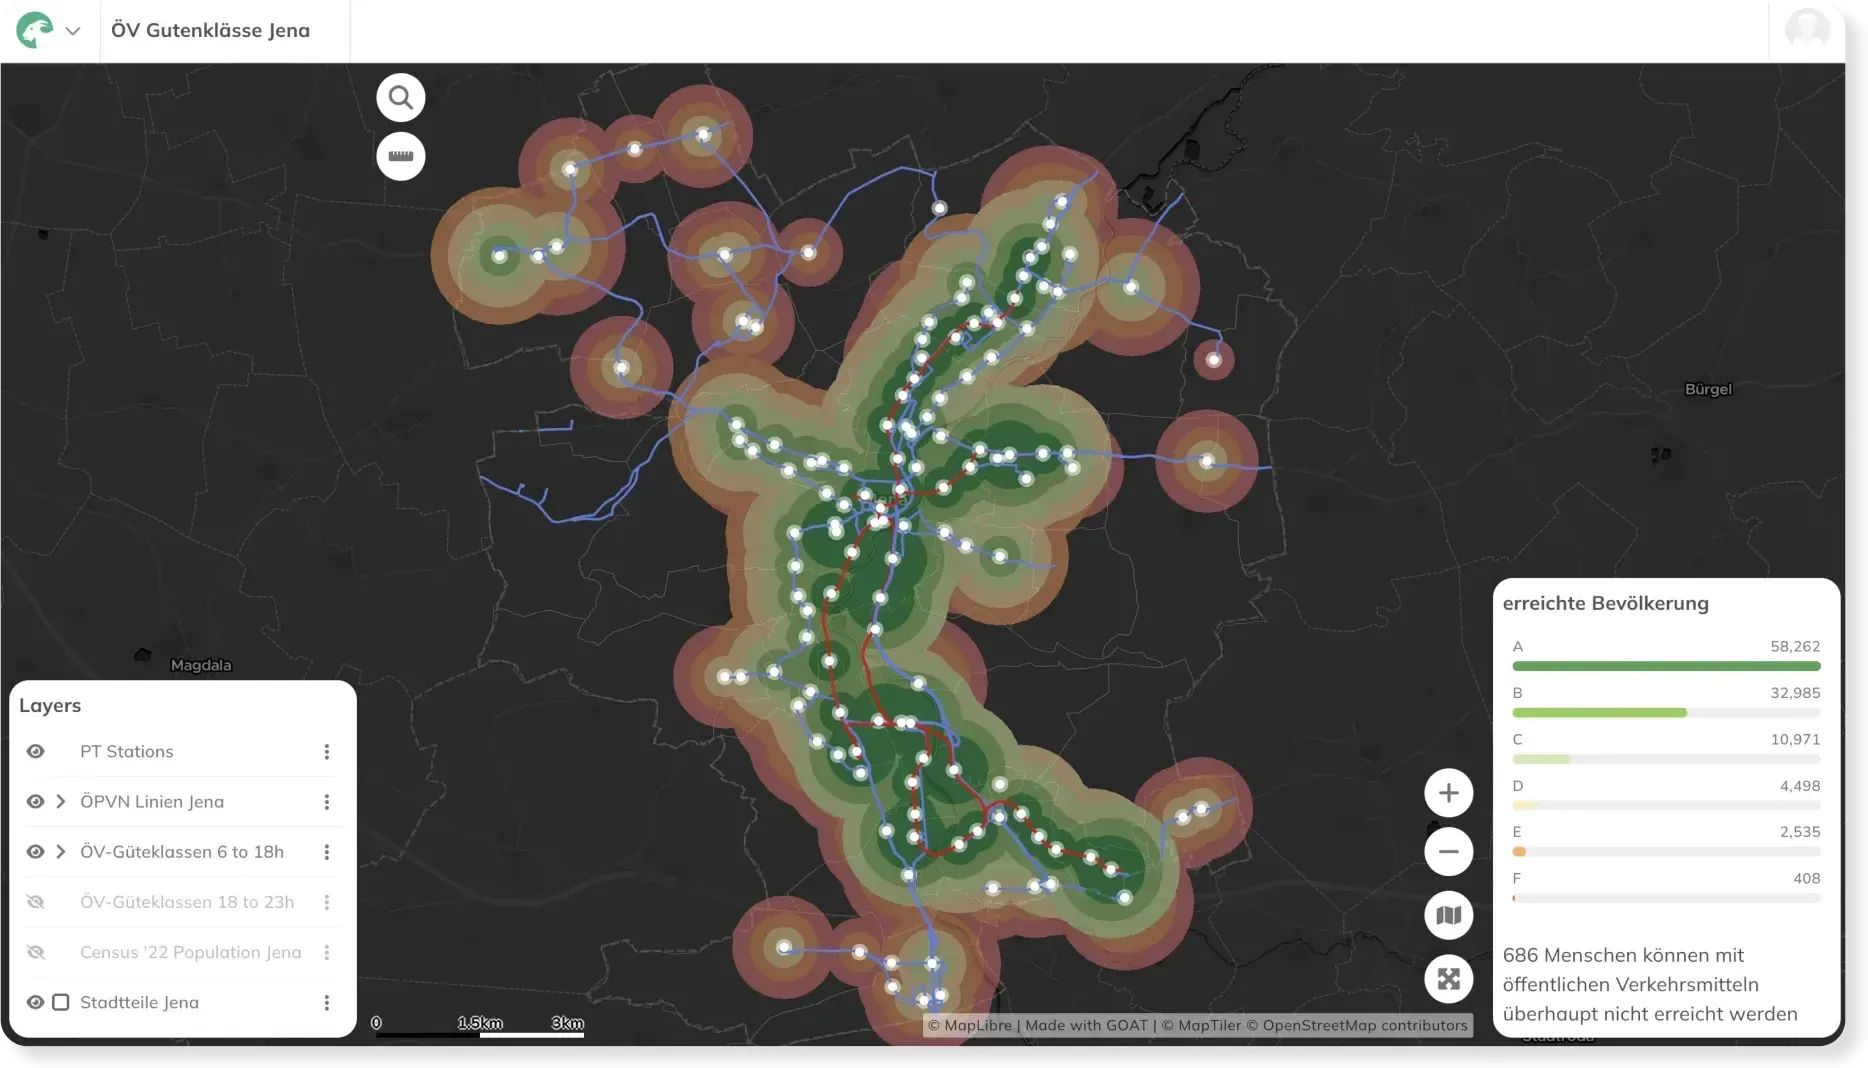
    This map shows the Public Transport Quality Classes (ÖV-Güteklassen) highlighting the attractiveness of public transport services for Jena.

    Check the map
  • 15-minute City Score across Germany

    15-minute City Score across Germany

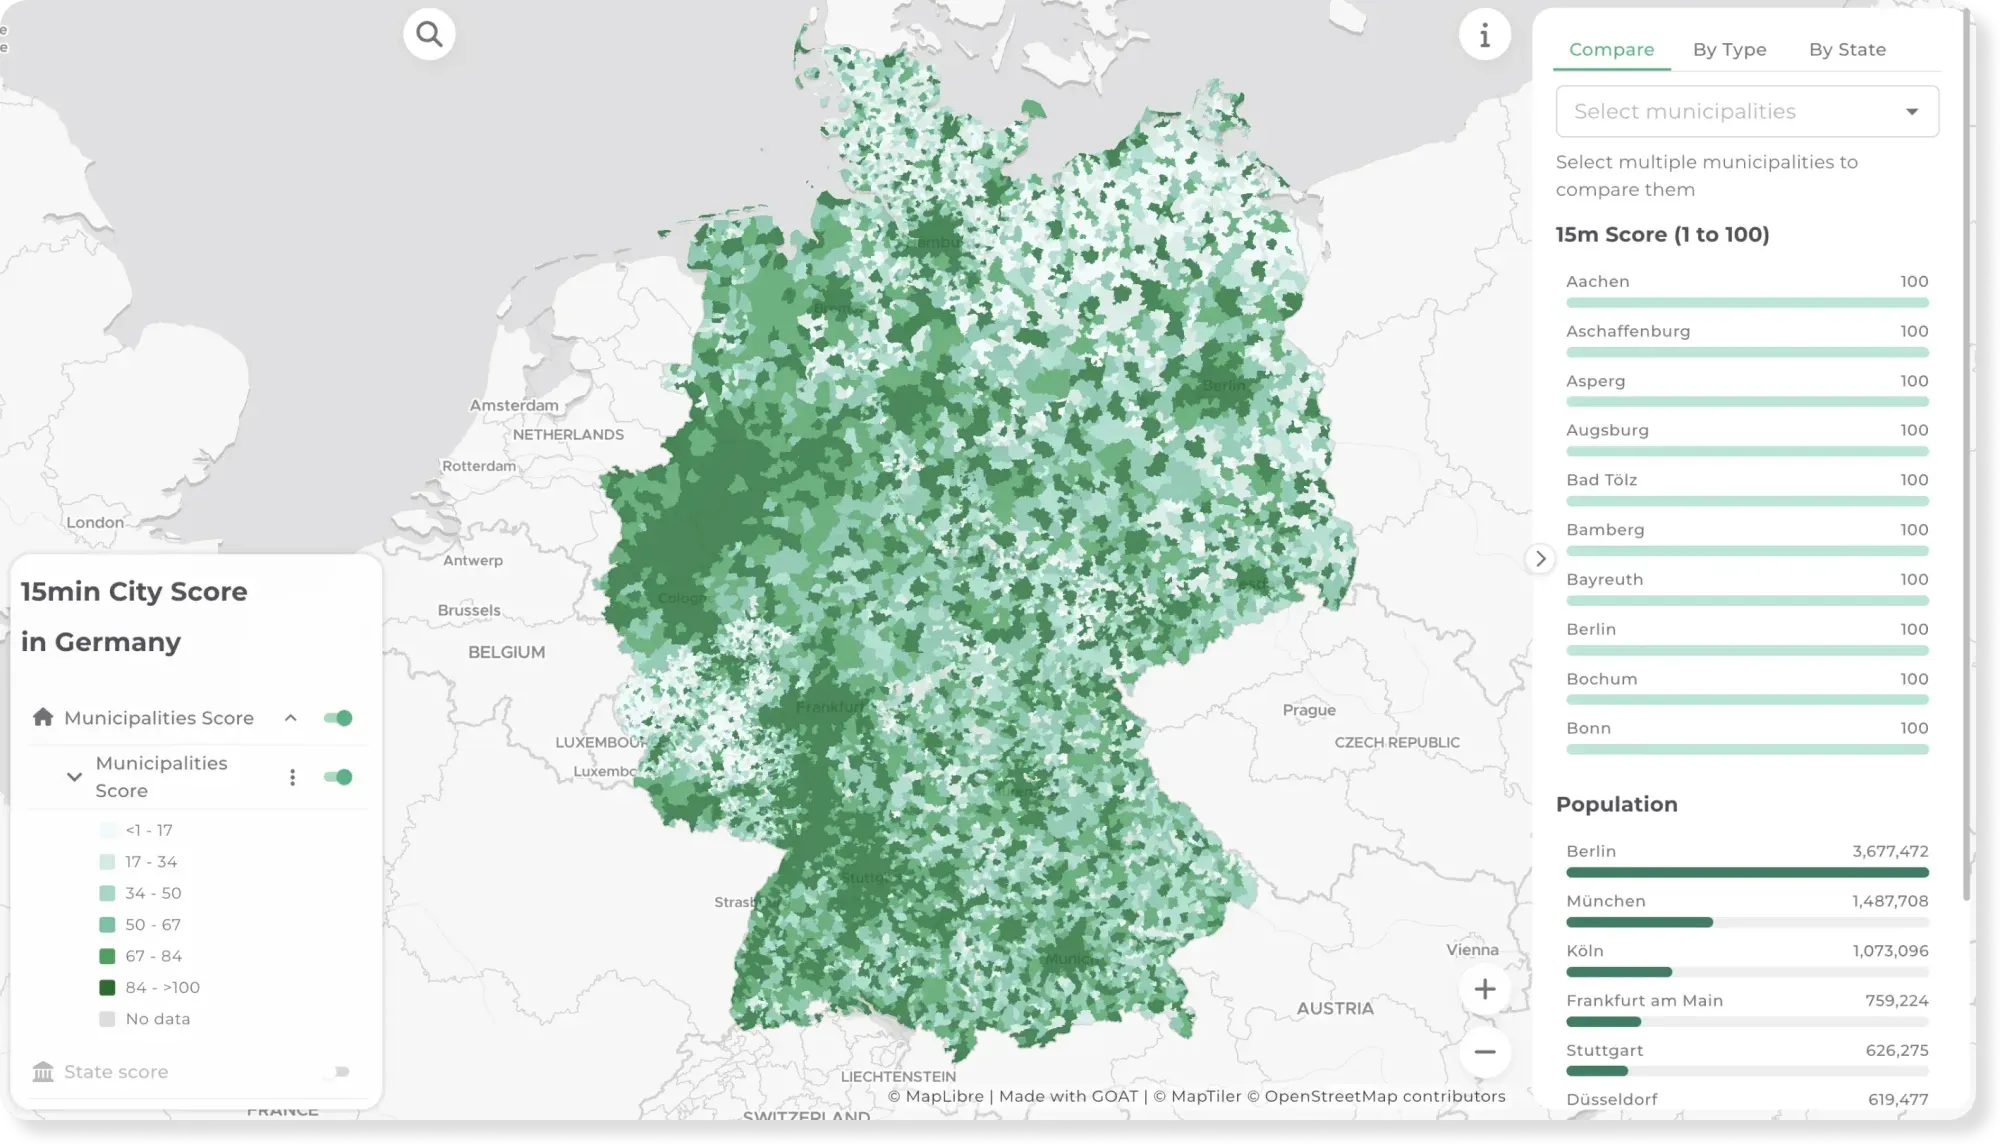
    Can you cover daily needs within a 15-minute walk? This map scores every municipality and state in Germany on the 15-minute city concept.

    Check the map
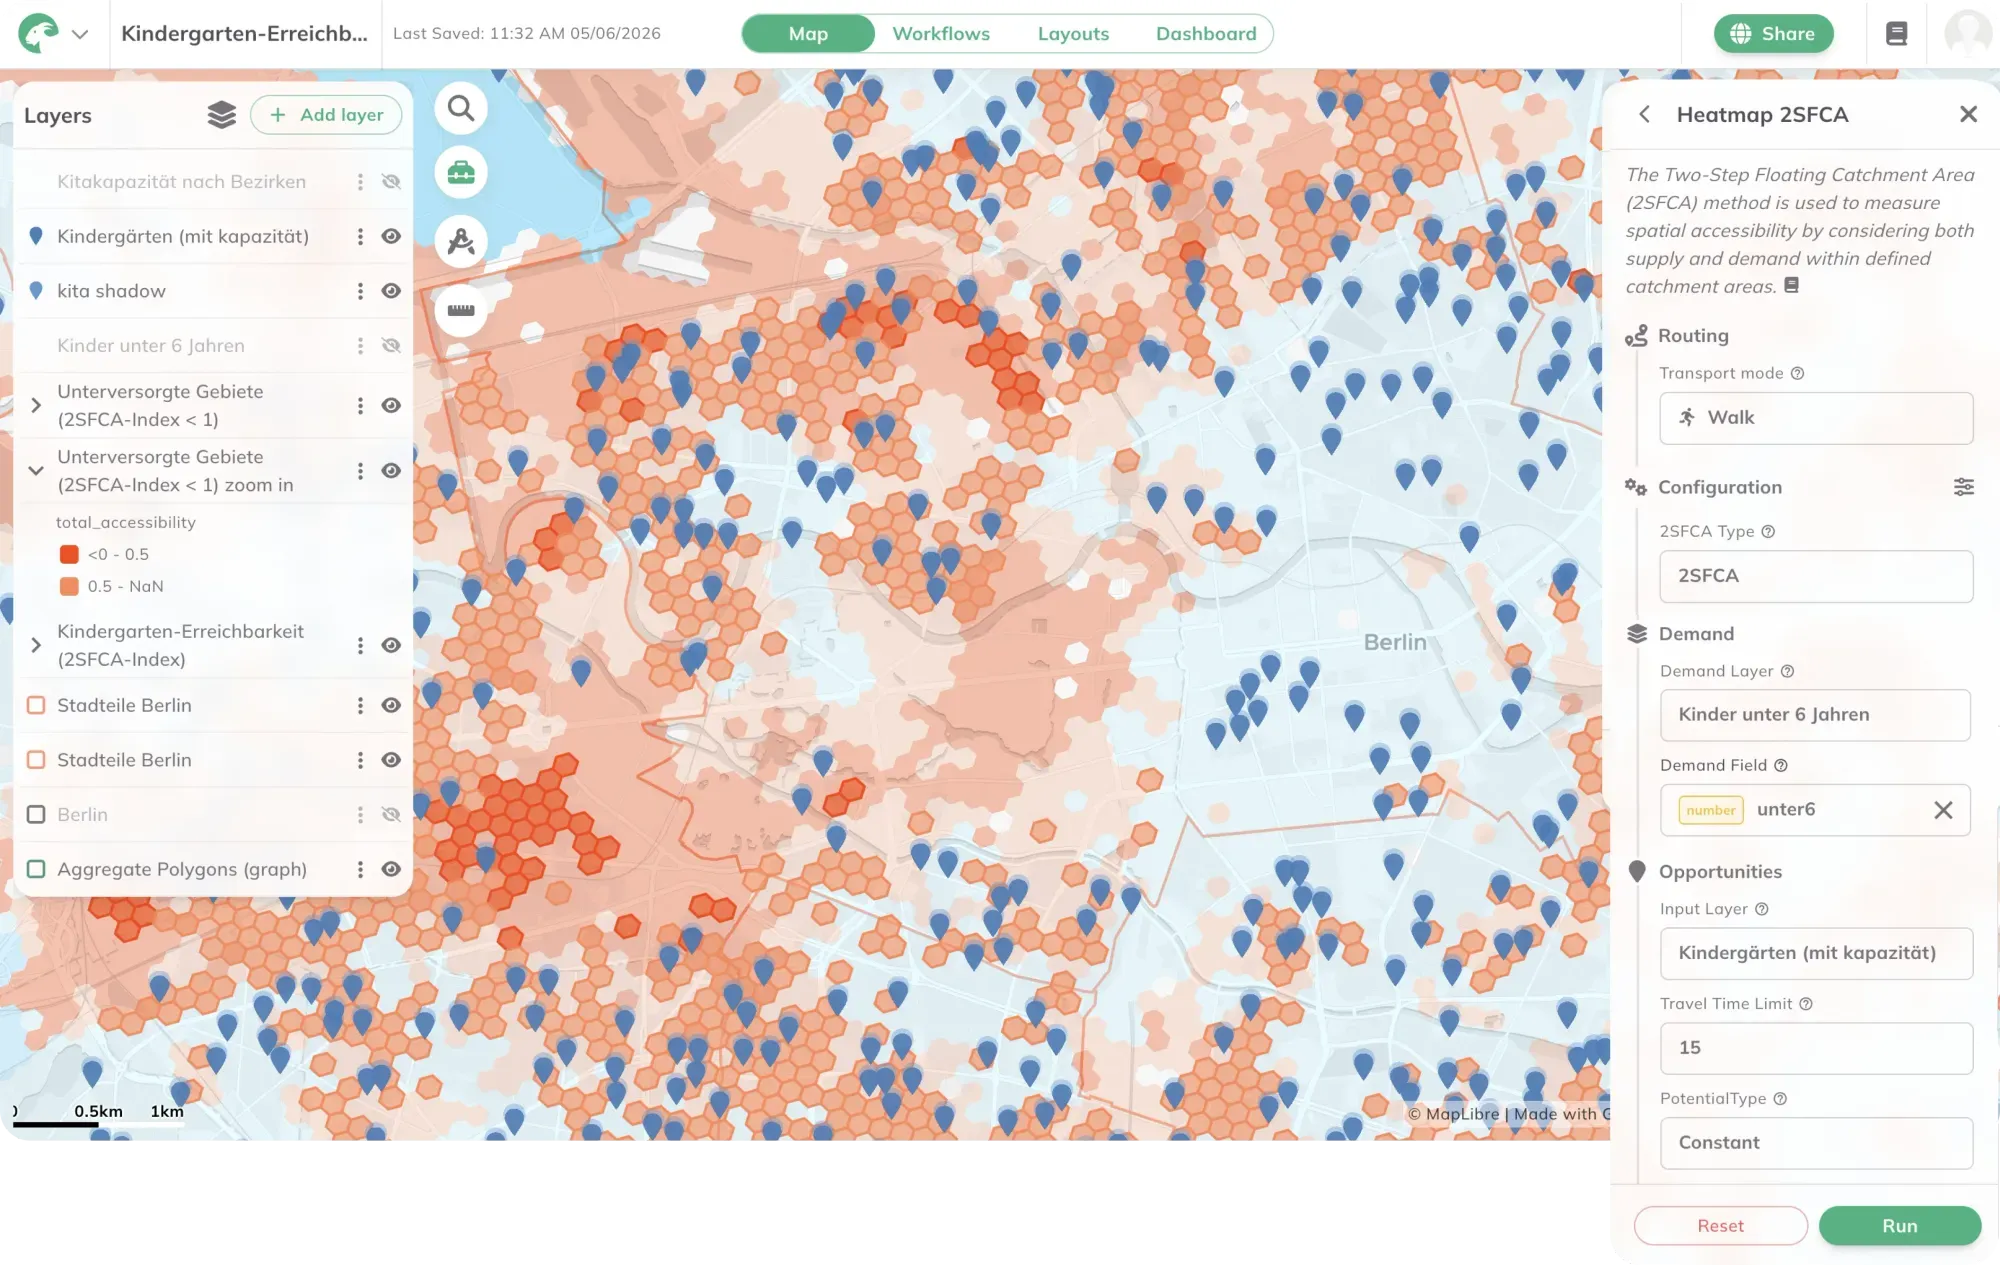
  • Kindergarden accessibility in Berlin: Distance and Capacity combined

    Kindergarden accessibility in Berlin: Distance and Capacity combined

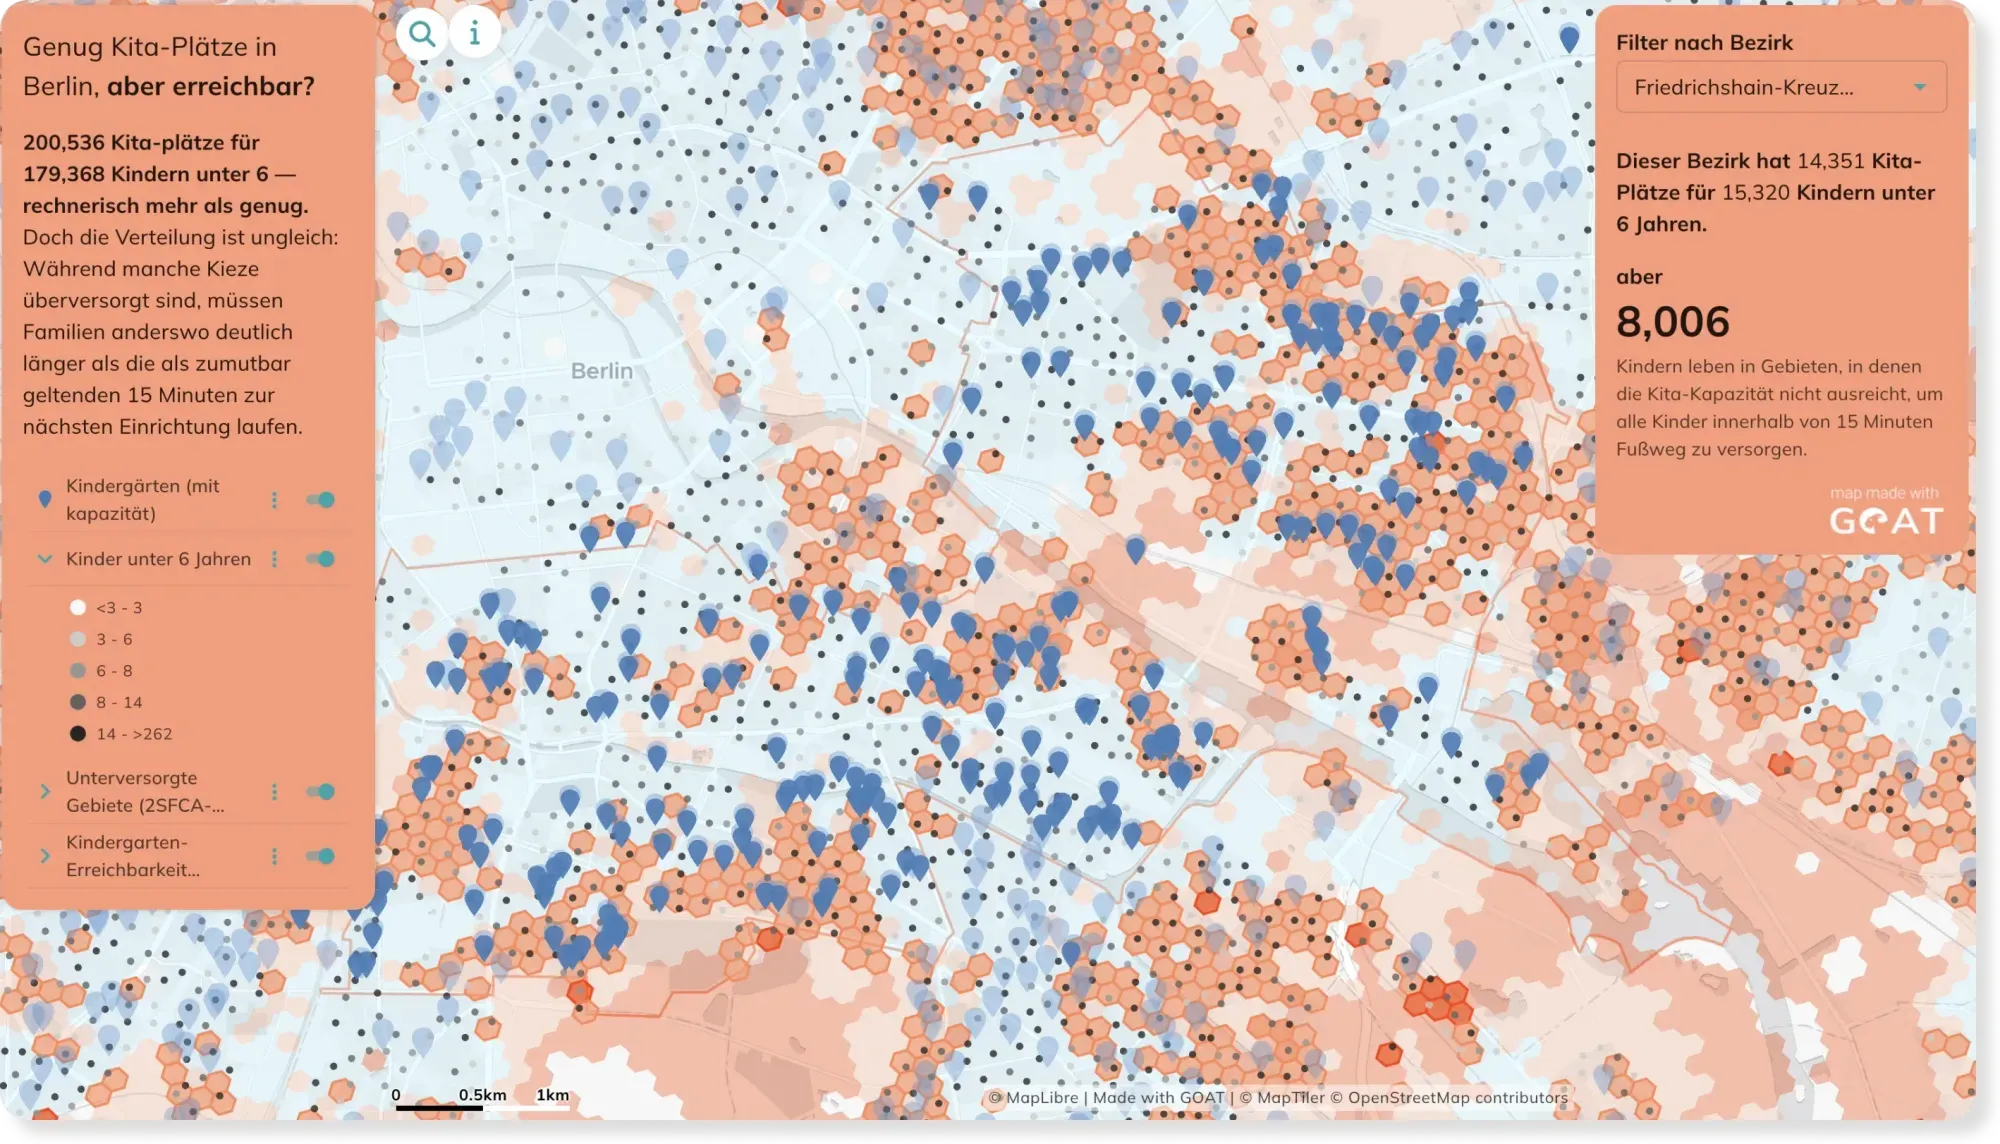
    A kindergarden five minutes away doesn't help if every place is already taken. This map goes beyond simple distance and factors in capacity too — showing where families are truly cared for.

    Check the map

The difference

Why GOAT?

  • Planning indicators and GIS tools, ready and easy to use

    ÖV-Güteklassen (public transport quality classes), public transport catchment areas, connectivity heatmaps and departure counts per stop: the indicators transport planning decisions rely on, ready to run with your parameters. Around them sits a full toolbox of GIS and data analysis tools, so you can bring your own GTFS or network data and analyse it without leaving the browser.

    Then save the whole thing as a workflow. When the data updates or a boundary changes, run it again. Same method, new result, no rebuilding.

  • A data catalog with AI-powered search

    Over 20,000 ready-to-use datasets: GTFS data, street networks, transport stops, population, administrative boundaries. Describe what you need and the catalog finds it, so you can start the analysis instead of procuring data first.

  • Ready to use, open by design

    Nothing to install. Built on open-source technologies and open standards, so your data and workflows stay portable.

  • Scalable

    From a single town check to state-wide coverage assessment.

  • Proven in practice

    Used for public transport quality assessments, mobility concepts and network planning in Germany and across borders.

See how Sinsheim is doing it

A whole-municipality look at cycling, walking and public transport, and what to do about the gaps.

Integrated Mobility Analysis for the City of Sinsheim

Integrated Mobility Analysis for the City of Sinsheim

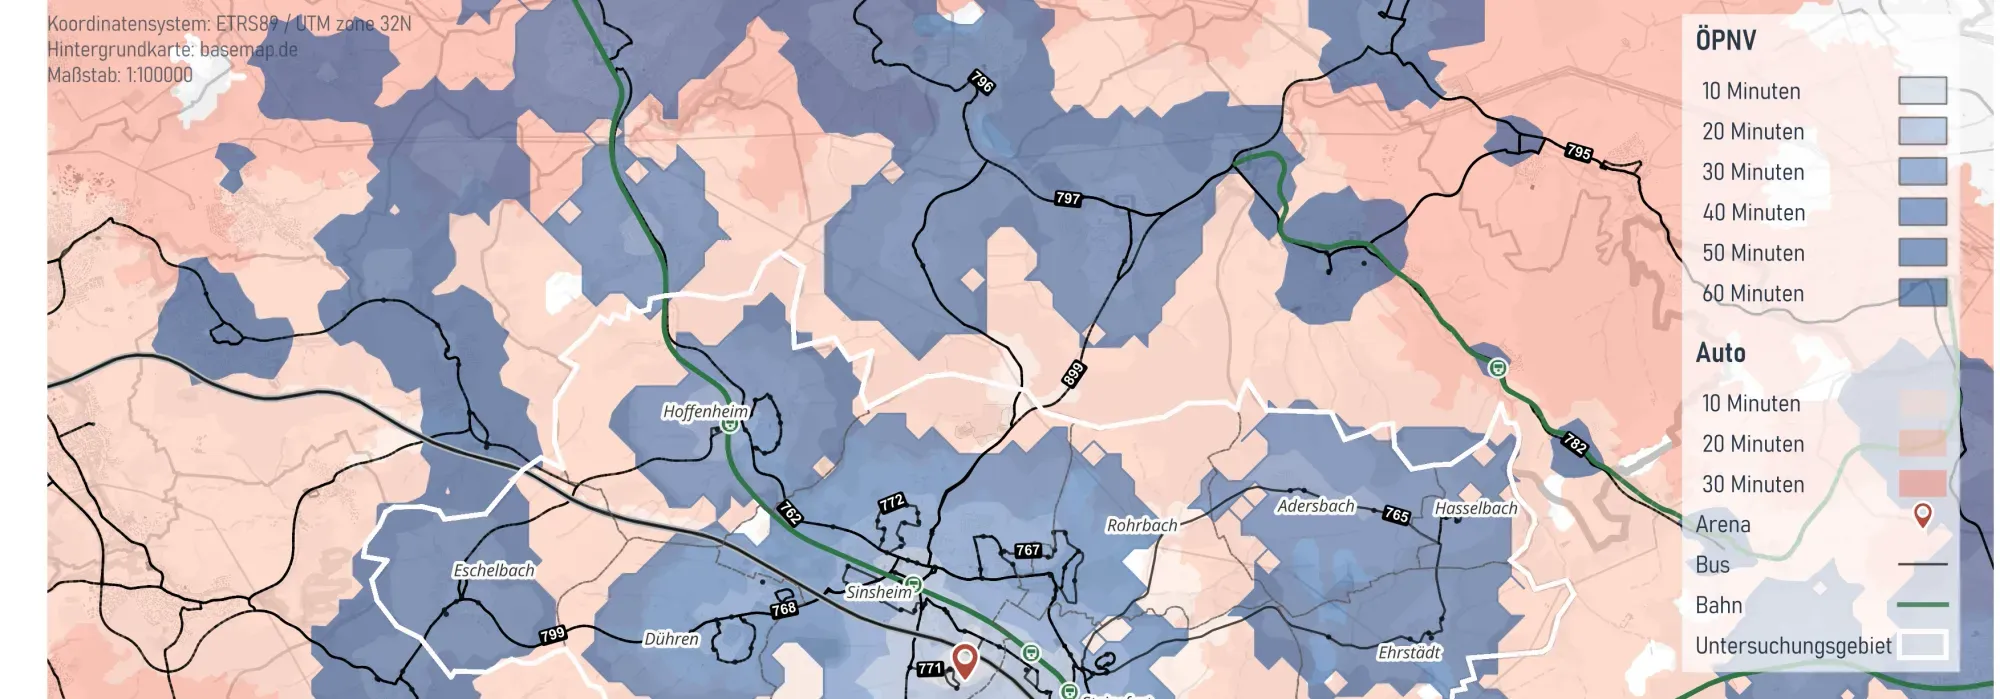
The City of Sinsheim commissioned Plan4Better to carry out an integrated mobility analysis of cycling, walking and public transport to reduce the high dependency on private motor traffic and identify improvement potentials for the city’s various transport modes.

Read the reference
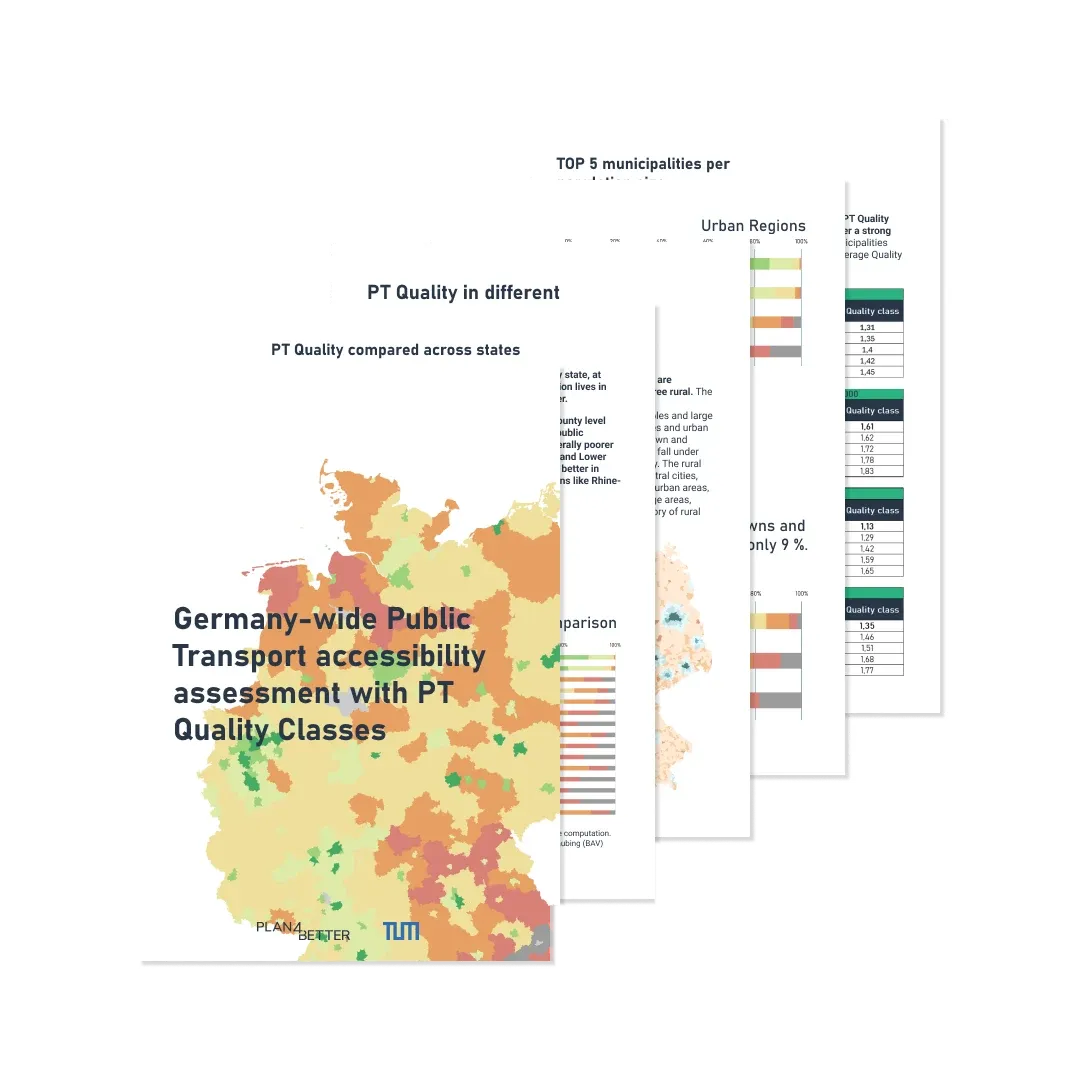
Pages from the Public Transport Quality whitepaper

Public Transport Quality

ÖV-Güteklassen explained: how public transport quality classes are calculated, what the standard leaves out, and how to compute them for any area from timetable data.

[object Object]

Fill out the form to download your free copy of the white paper

You can unsubscribe from these notifications at any time. For more information about unsubscribing, our privacy practices and how we protect and respect your privacy, please see our Privacy Policy.

This form is not connected yet — the download is not being delivered.

Ready to make sense of your data?

Join planners, organizations and cities using GOAT to make better decisions, faster. No GIS expertise needed.