Plan4Better

Industries

Cities & Government

Cities and government agencies must make faster, better-informed decisions about infrastructure, mobility, and land use — with limited resources. GOAT makes powerful spatial analysis accessible to any planner, no GIS expertise required.

GOAT spatial analysis dashboards for cities and government agencies
GOAT dashboard analysing land use patterns for urban development planning

Analyse Land Use Patterns & Plan Development

Analyse land use patterns, evaluate location suitability, and model the spatial impact of planning decisions — all within a single platform. GOAT supports digital development planning and enables planners to run scenario analyses before committing to costly infrastructure changes.

See how GOAT is used for land-use planning
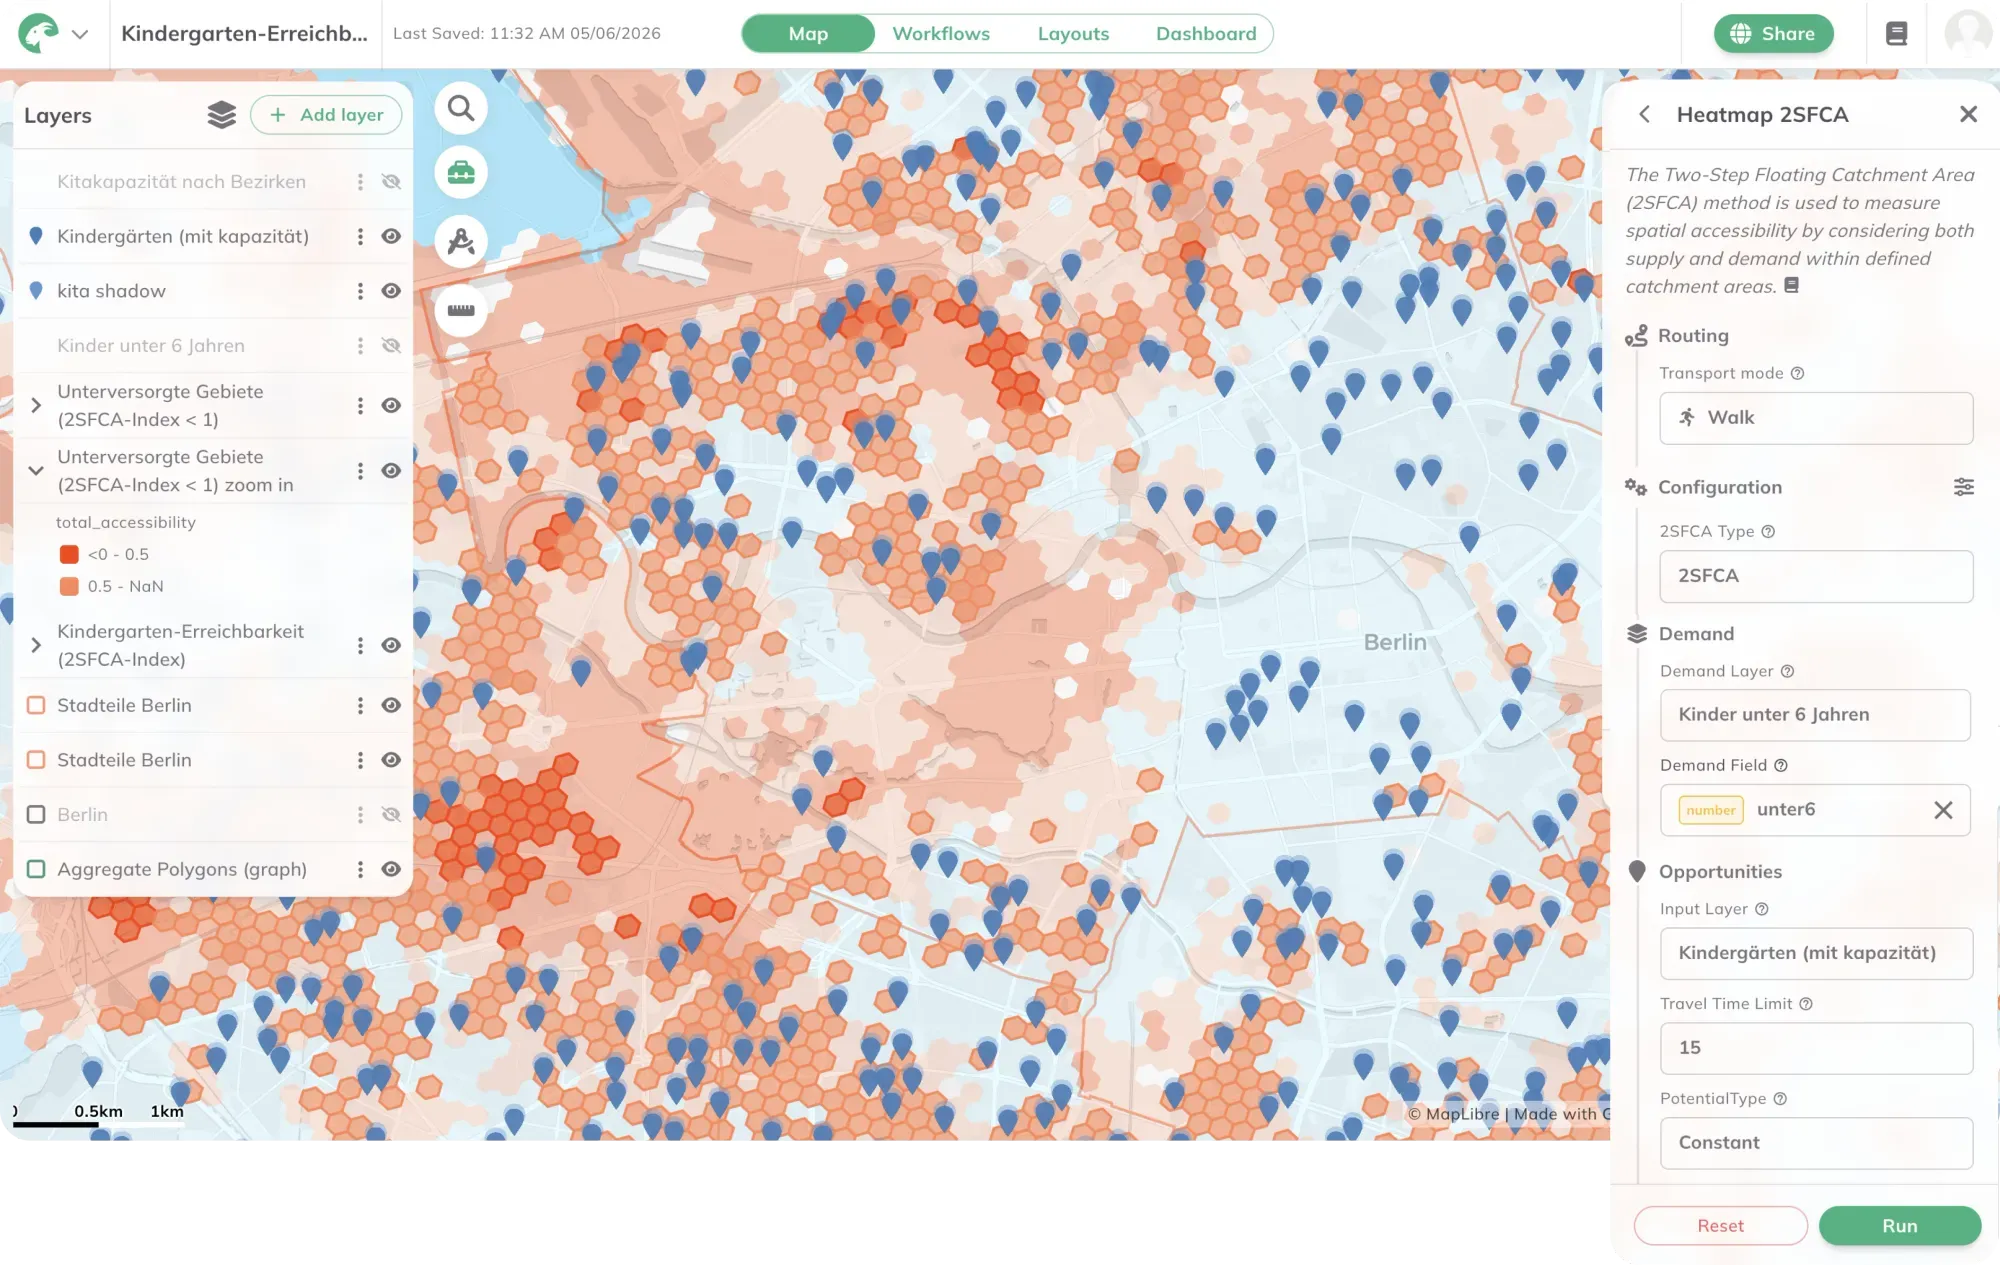
Walking and cycling accessibility analysis to key destinations in GOAT

Map Walking & Cycling Accessibility to Key Destinations

Assess how well residents can reach essential services — supermarkets, schools, healthcare, public transport stops — by foot, bicycle, or transit. GOAT's accessibility indicators help cities identify underserved areas and prioritise investments in walking, cycling, and public transport infrastructure.

See how GOAT is used for accessibility analysis
Location-specific parking demand modelling in GOAT

Parking Demand Modelling

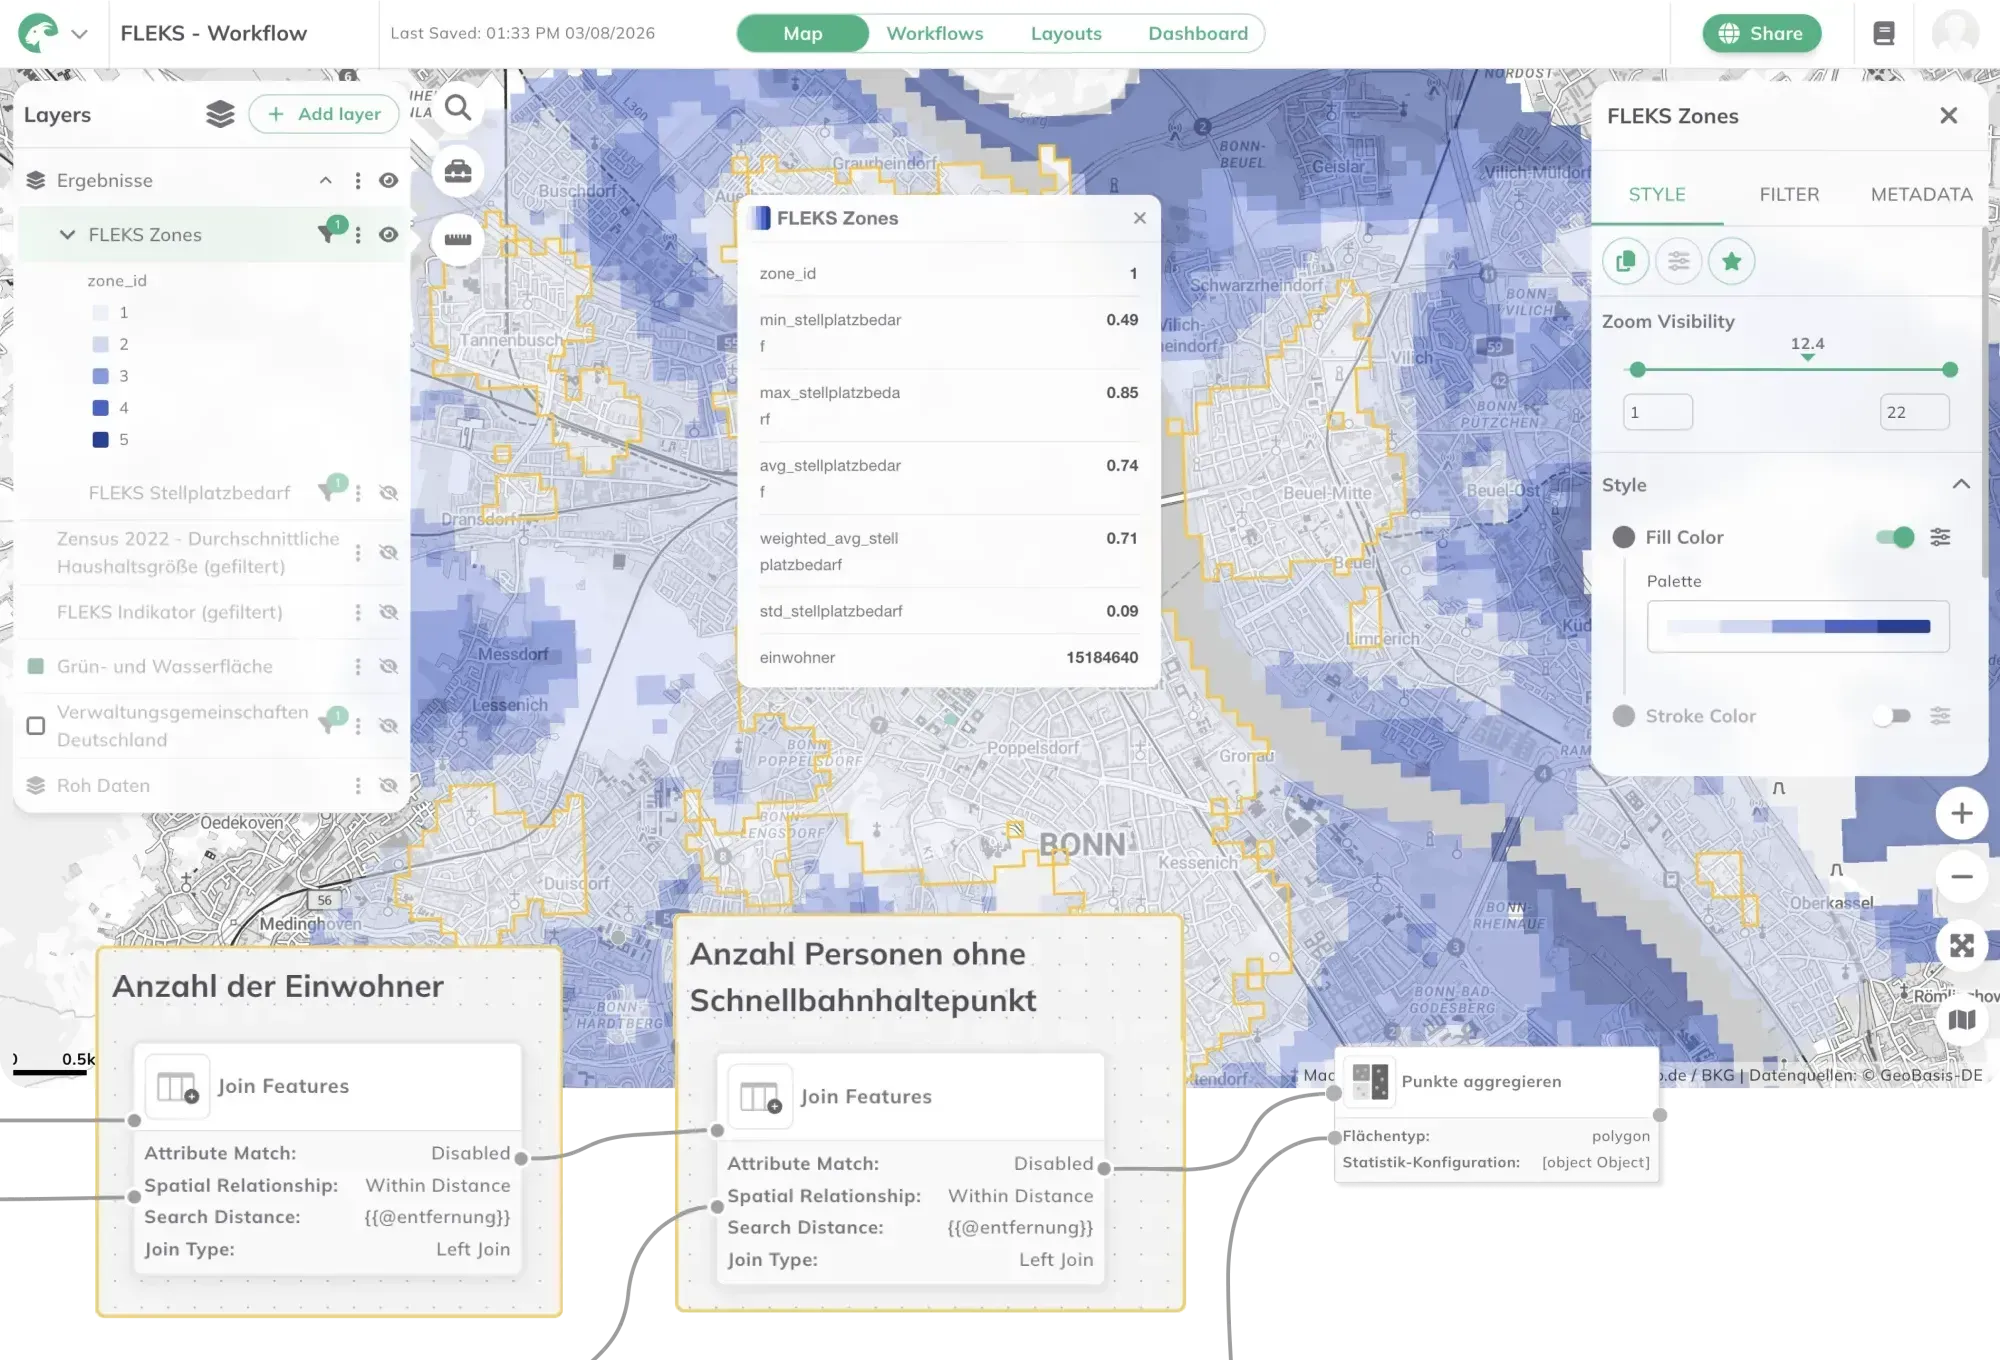
Calculate location-specific parking space requirements based on high-resolution sociodemographic data, public transport quality classes, car ownership rates, and land use context. GOAT's indicator-based approach — as demonstrated in the FLEKS project for the City of Munich — enables flexible, location-differentiated parking concepts that reduce construction costs while meeting actual demand.

See how the FLEKS project is modelling parking with GOAT

Maps made with GOAT

Real analyses built by planners, researchers, and cities — explore what's possible before you start your own.

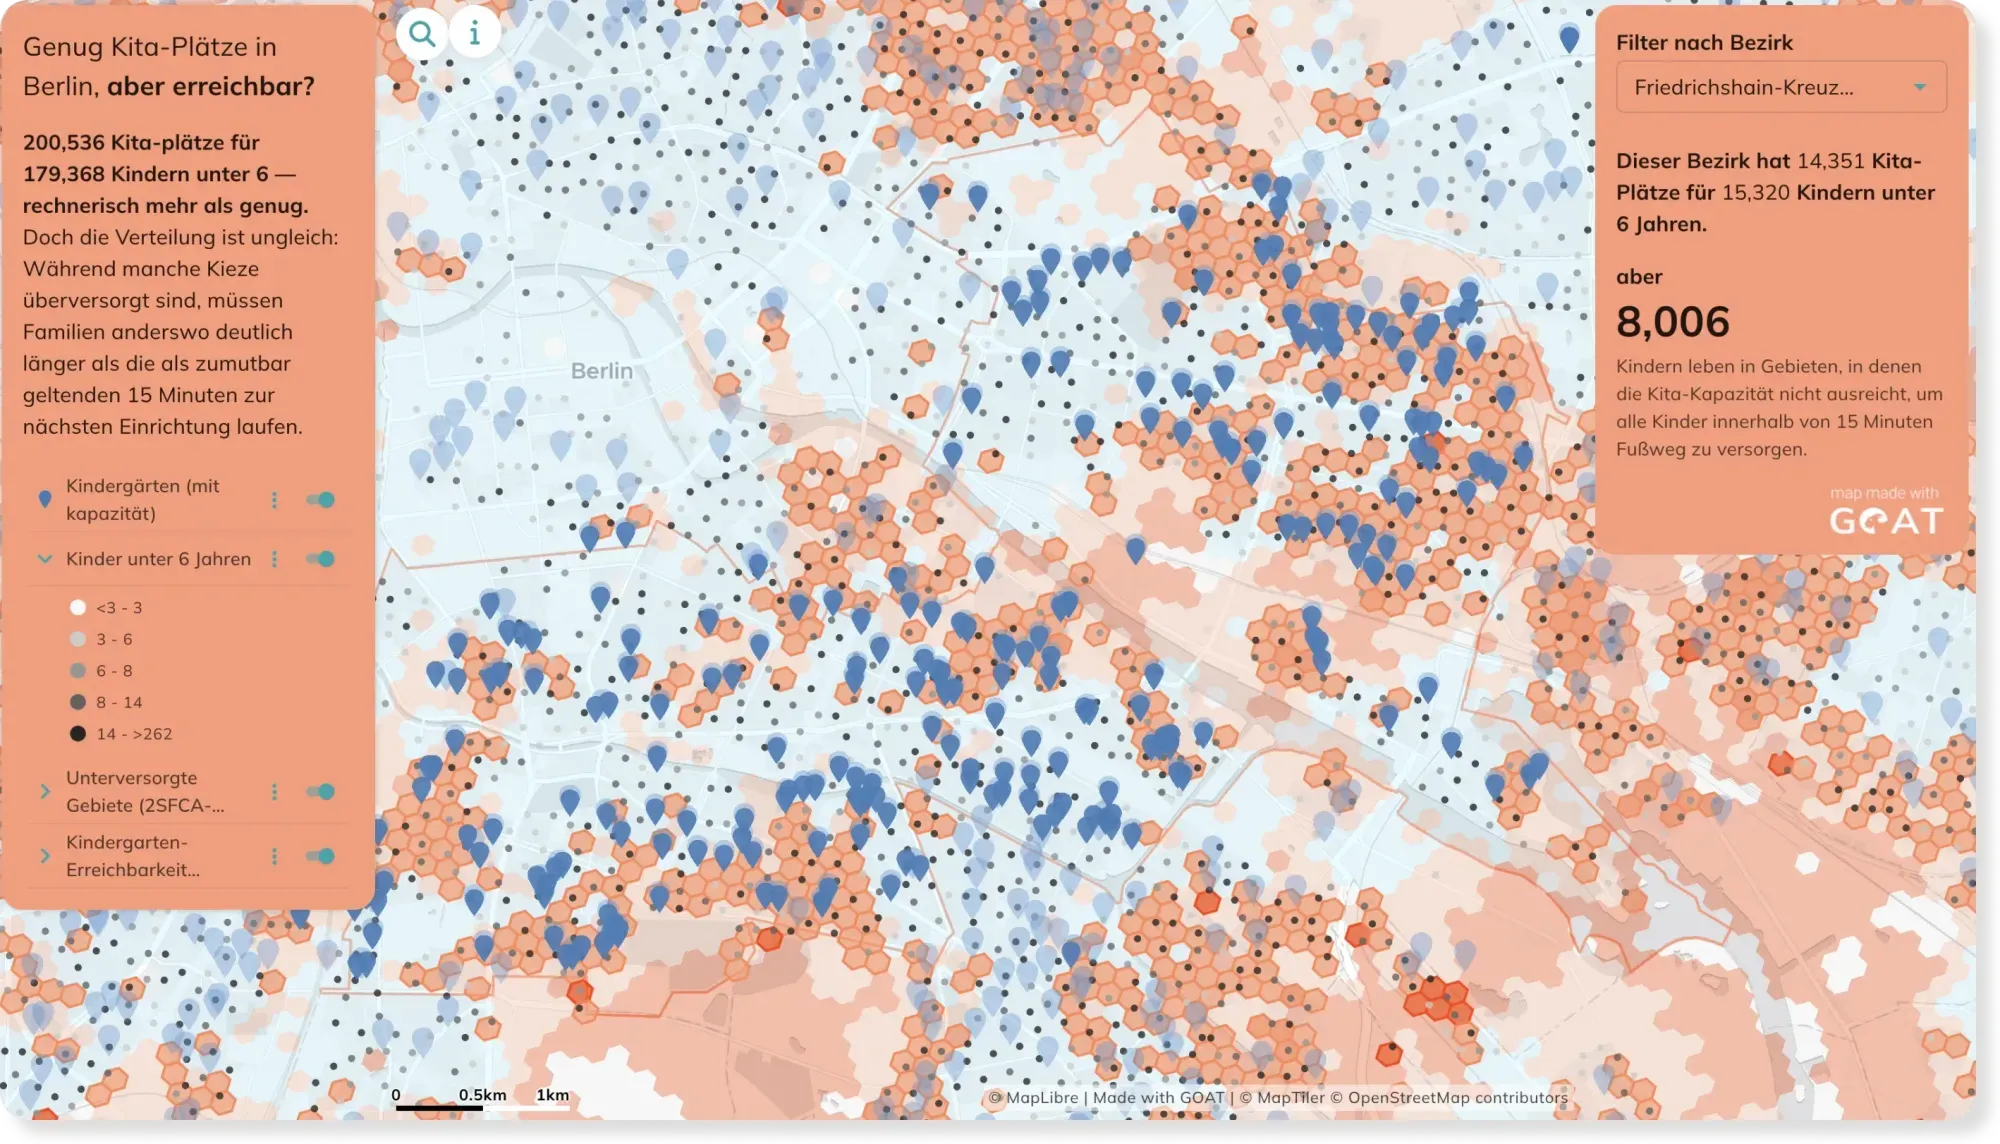
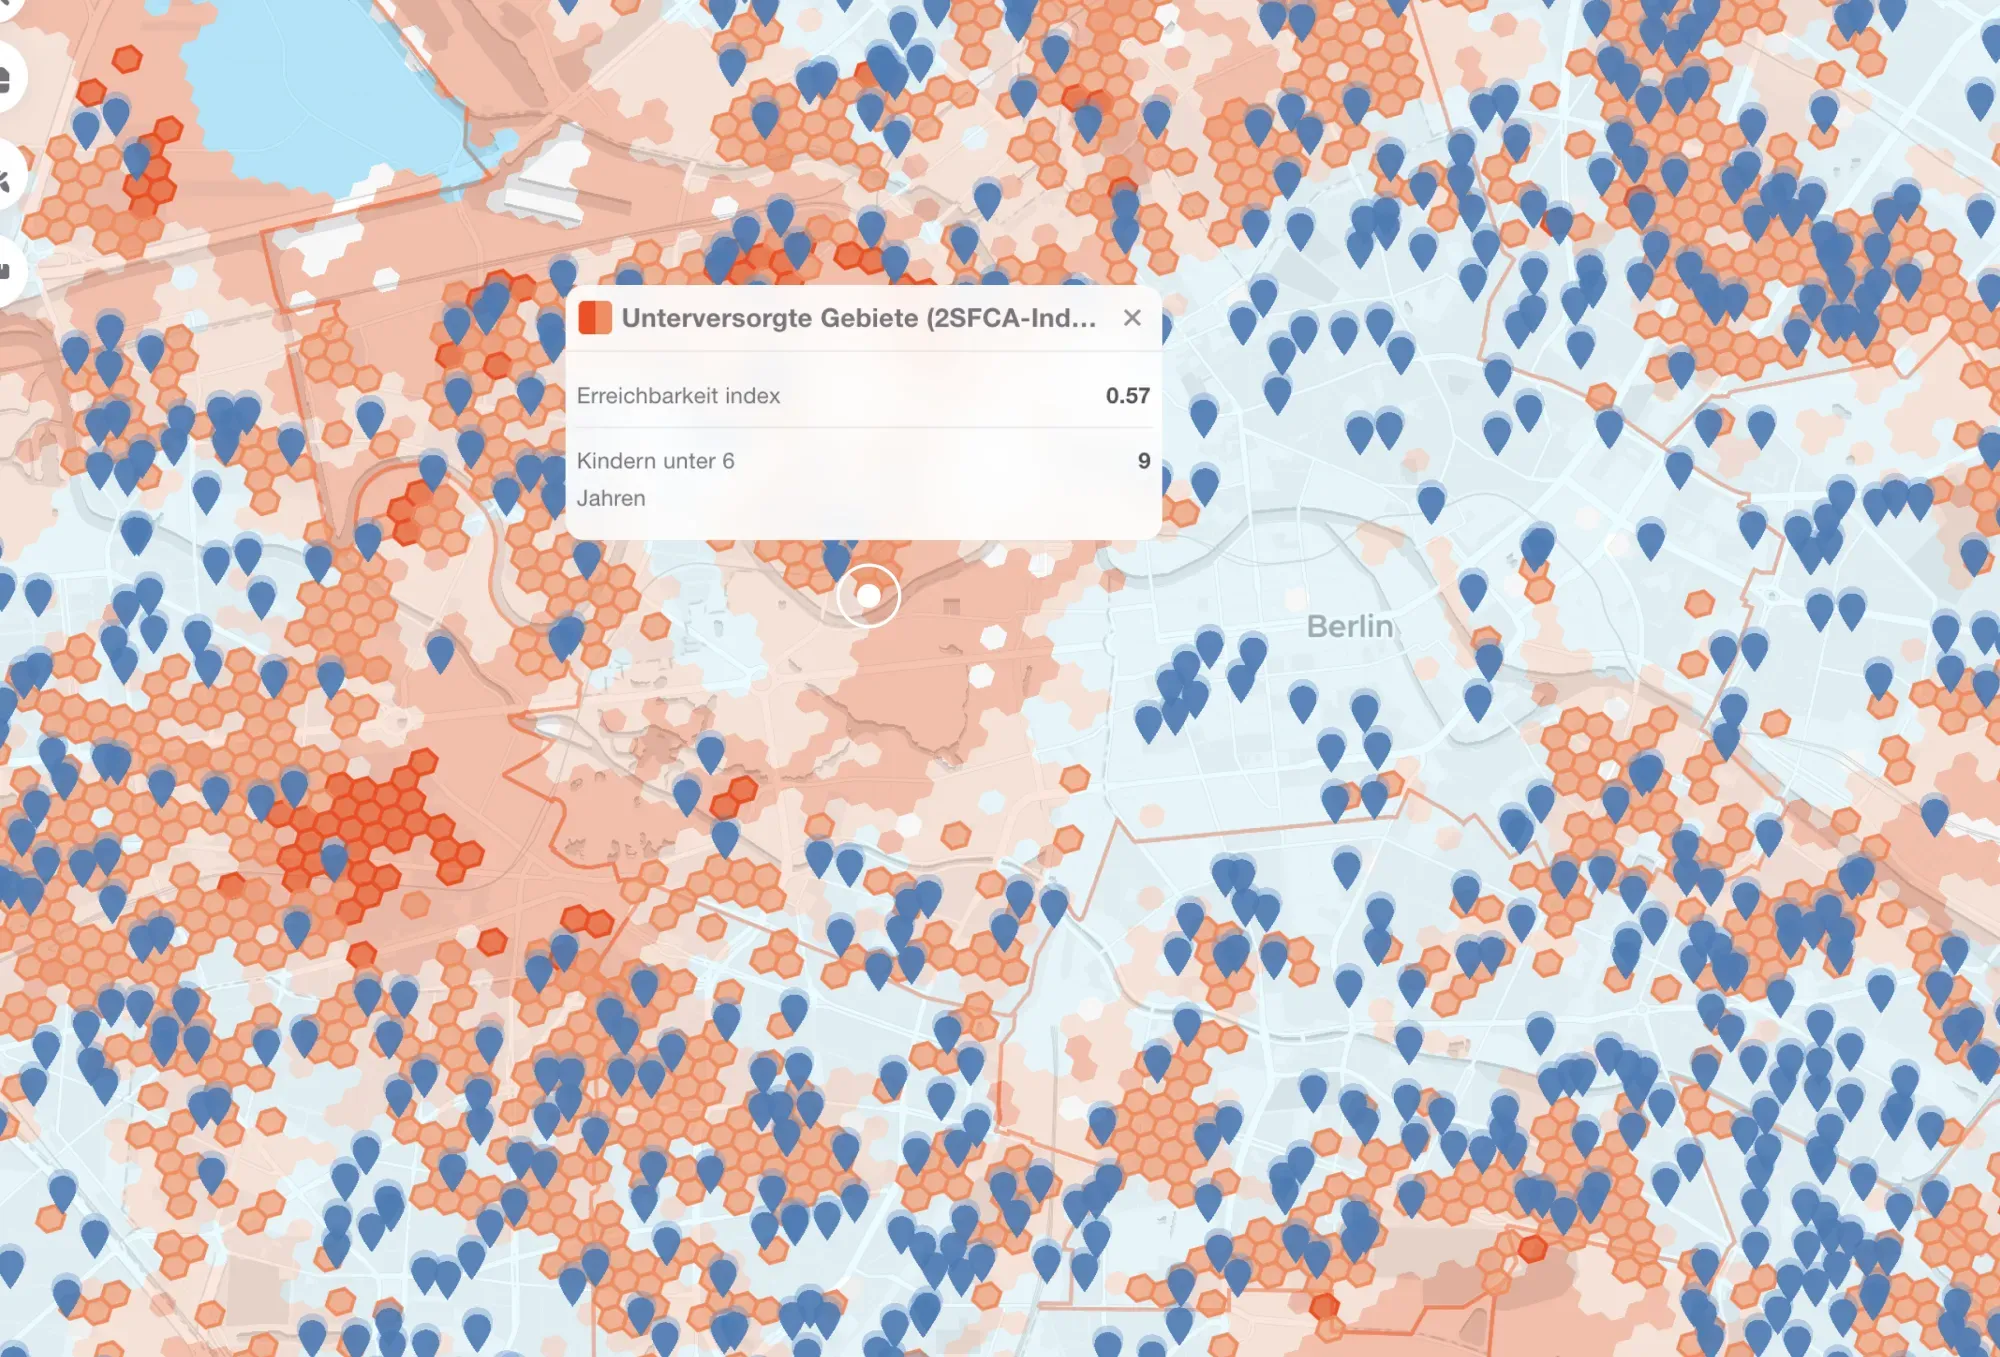
  • Kindergarten accessibility in Berlin, combining walking distance with available places

    Kindergarden accessibility in Berlin: Distance and Capacity combined

    A kindergarden five minutes away doesn't help if every place is already taken. This map goes beyond simple distance and factors in capacity too — showing where families are truly cared for.

    Check the map
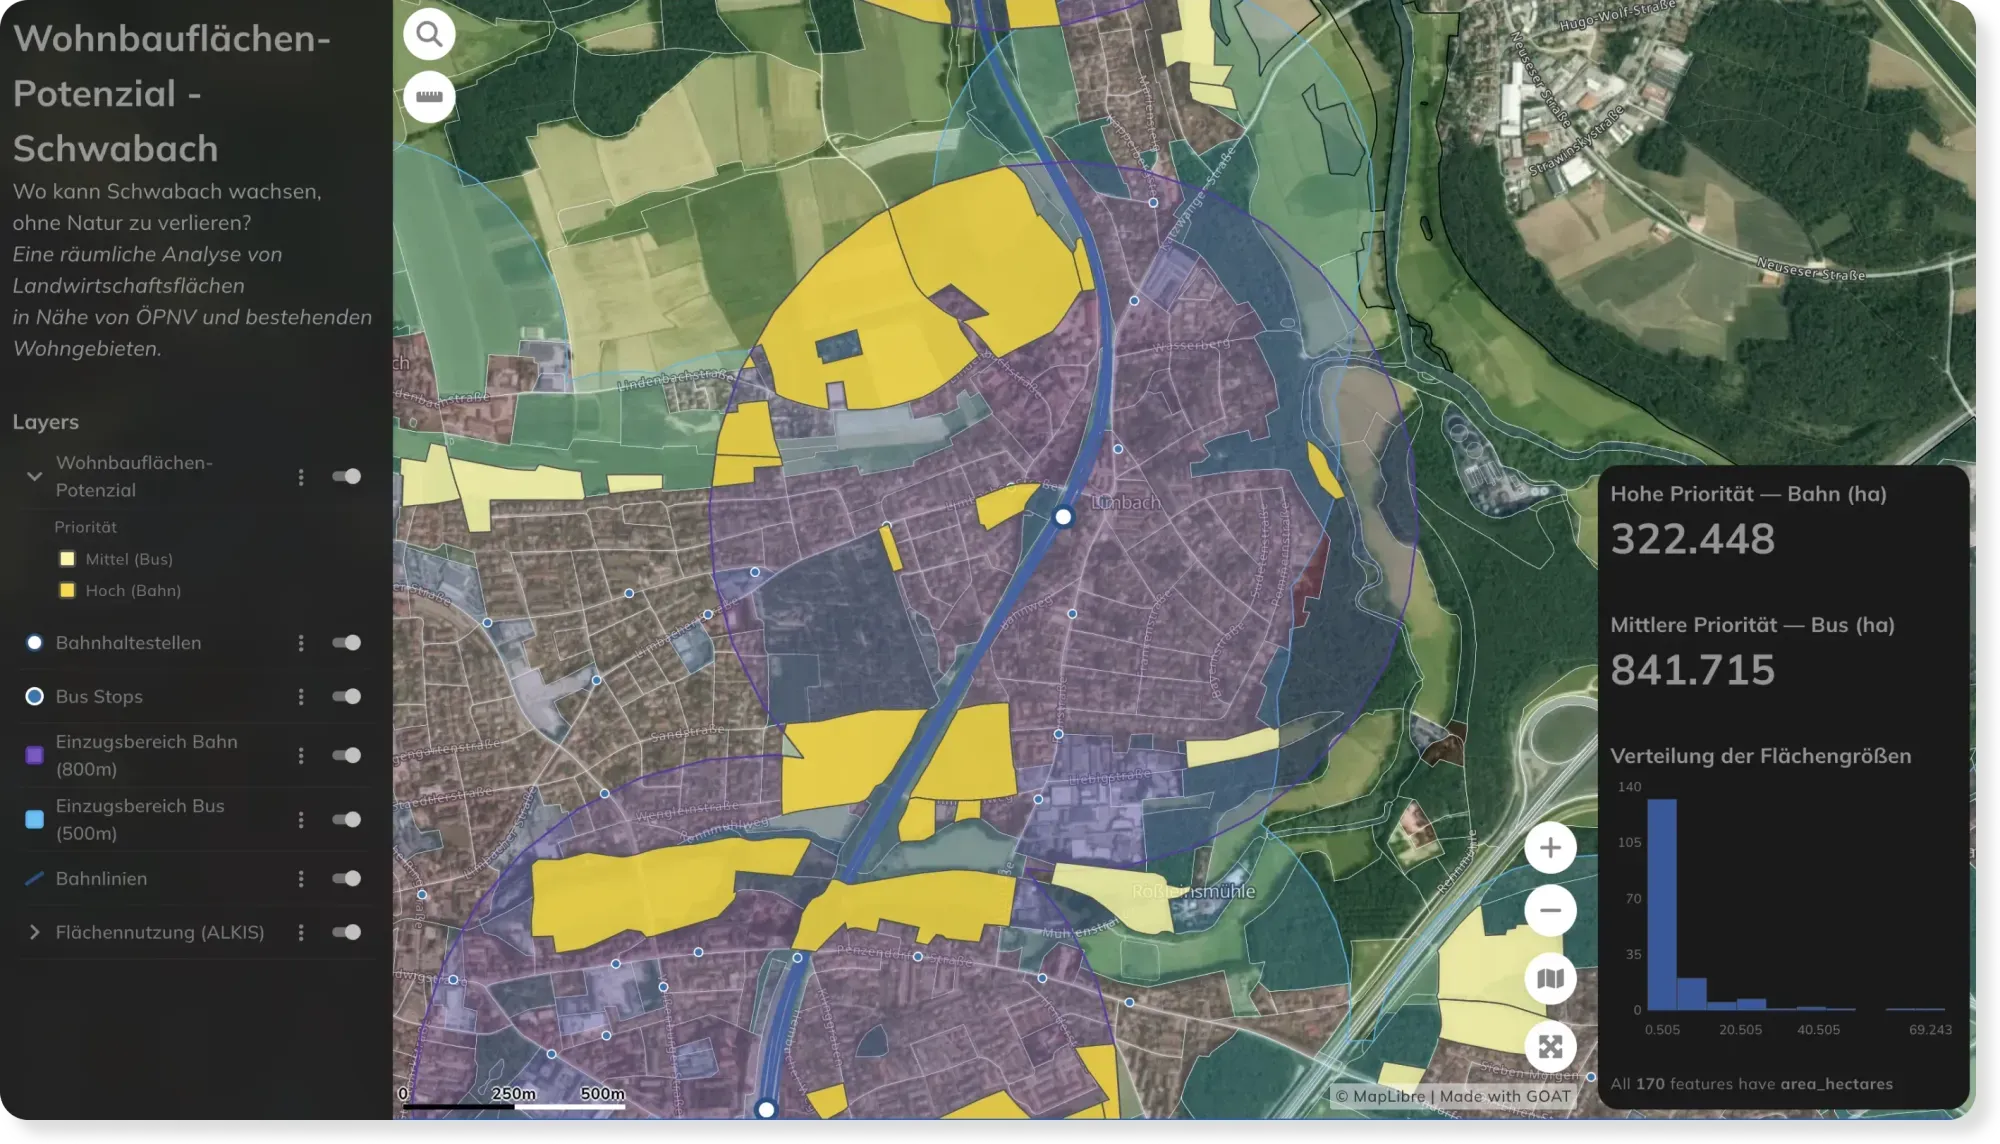
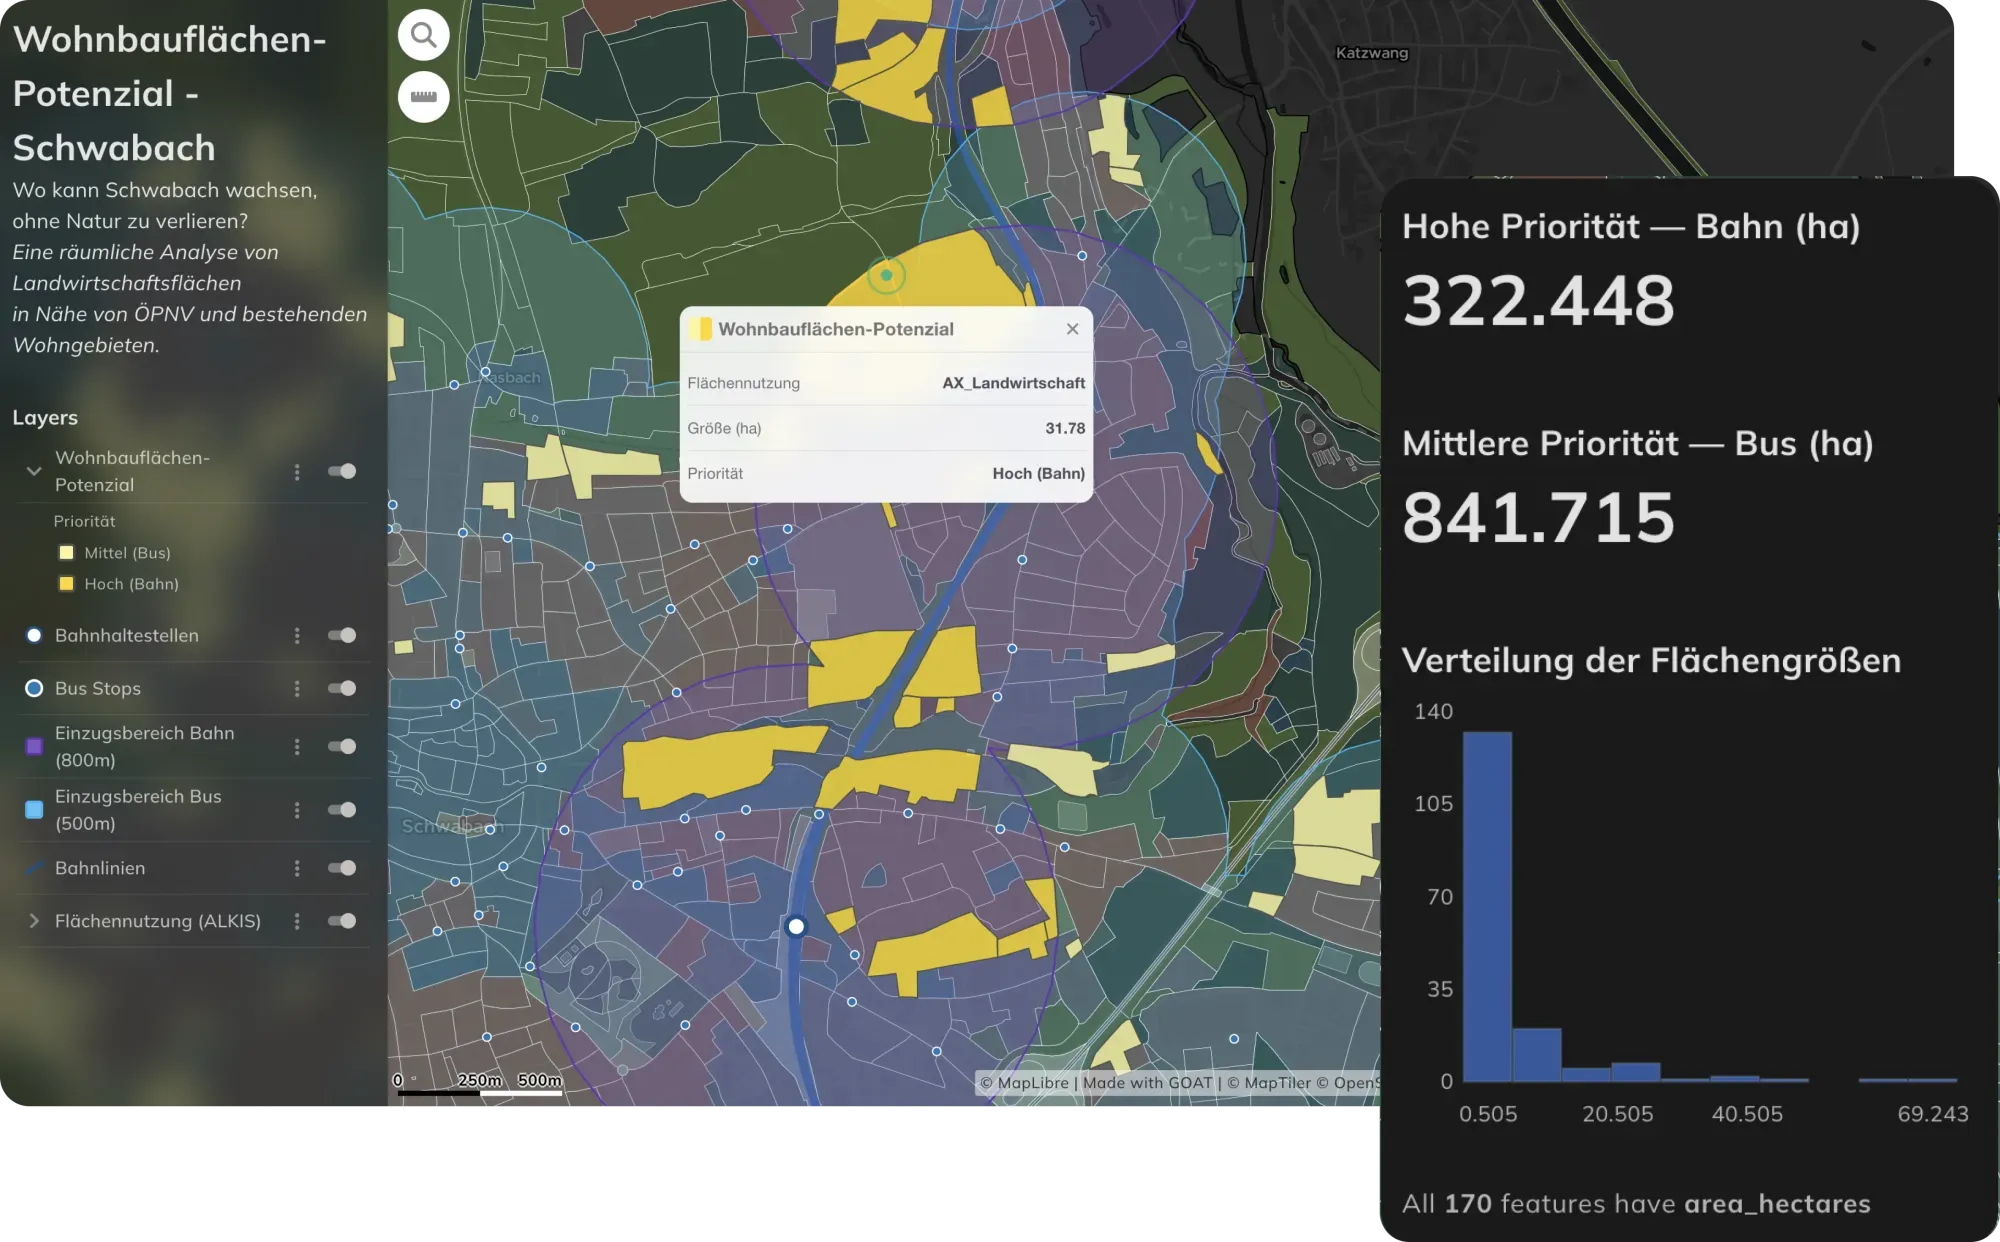
  • Land use and development potential mapped across Schwabach

    Land Use & Development Potential in Schwabach

    See how land is used across Schwabach — and where there's room to grow. An open land-use map for planners, developers, and citizens.

    Check the map
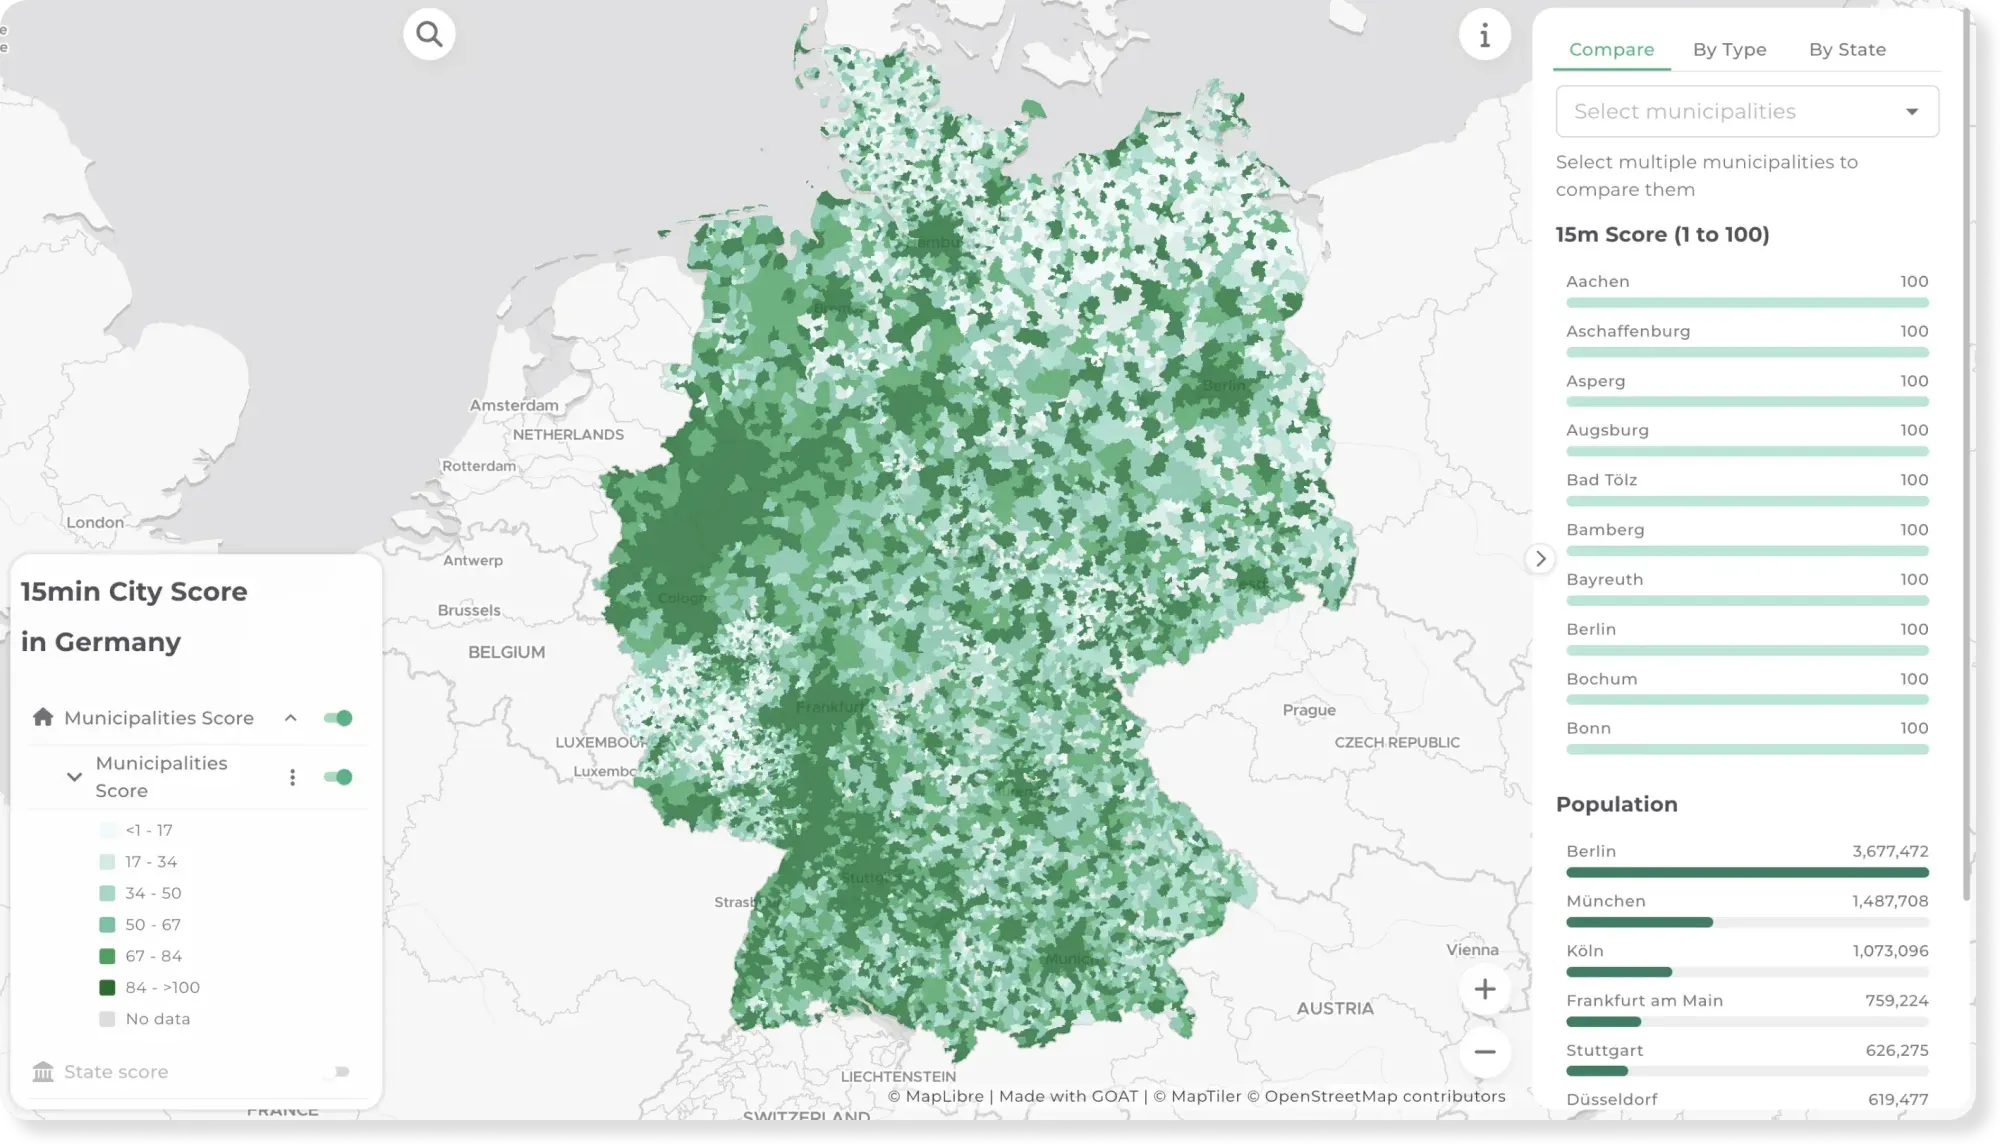
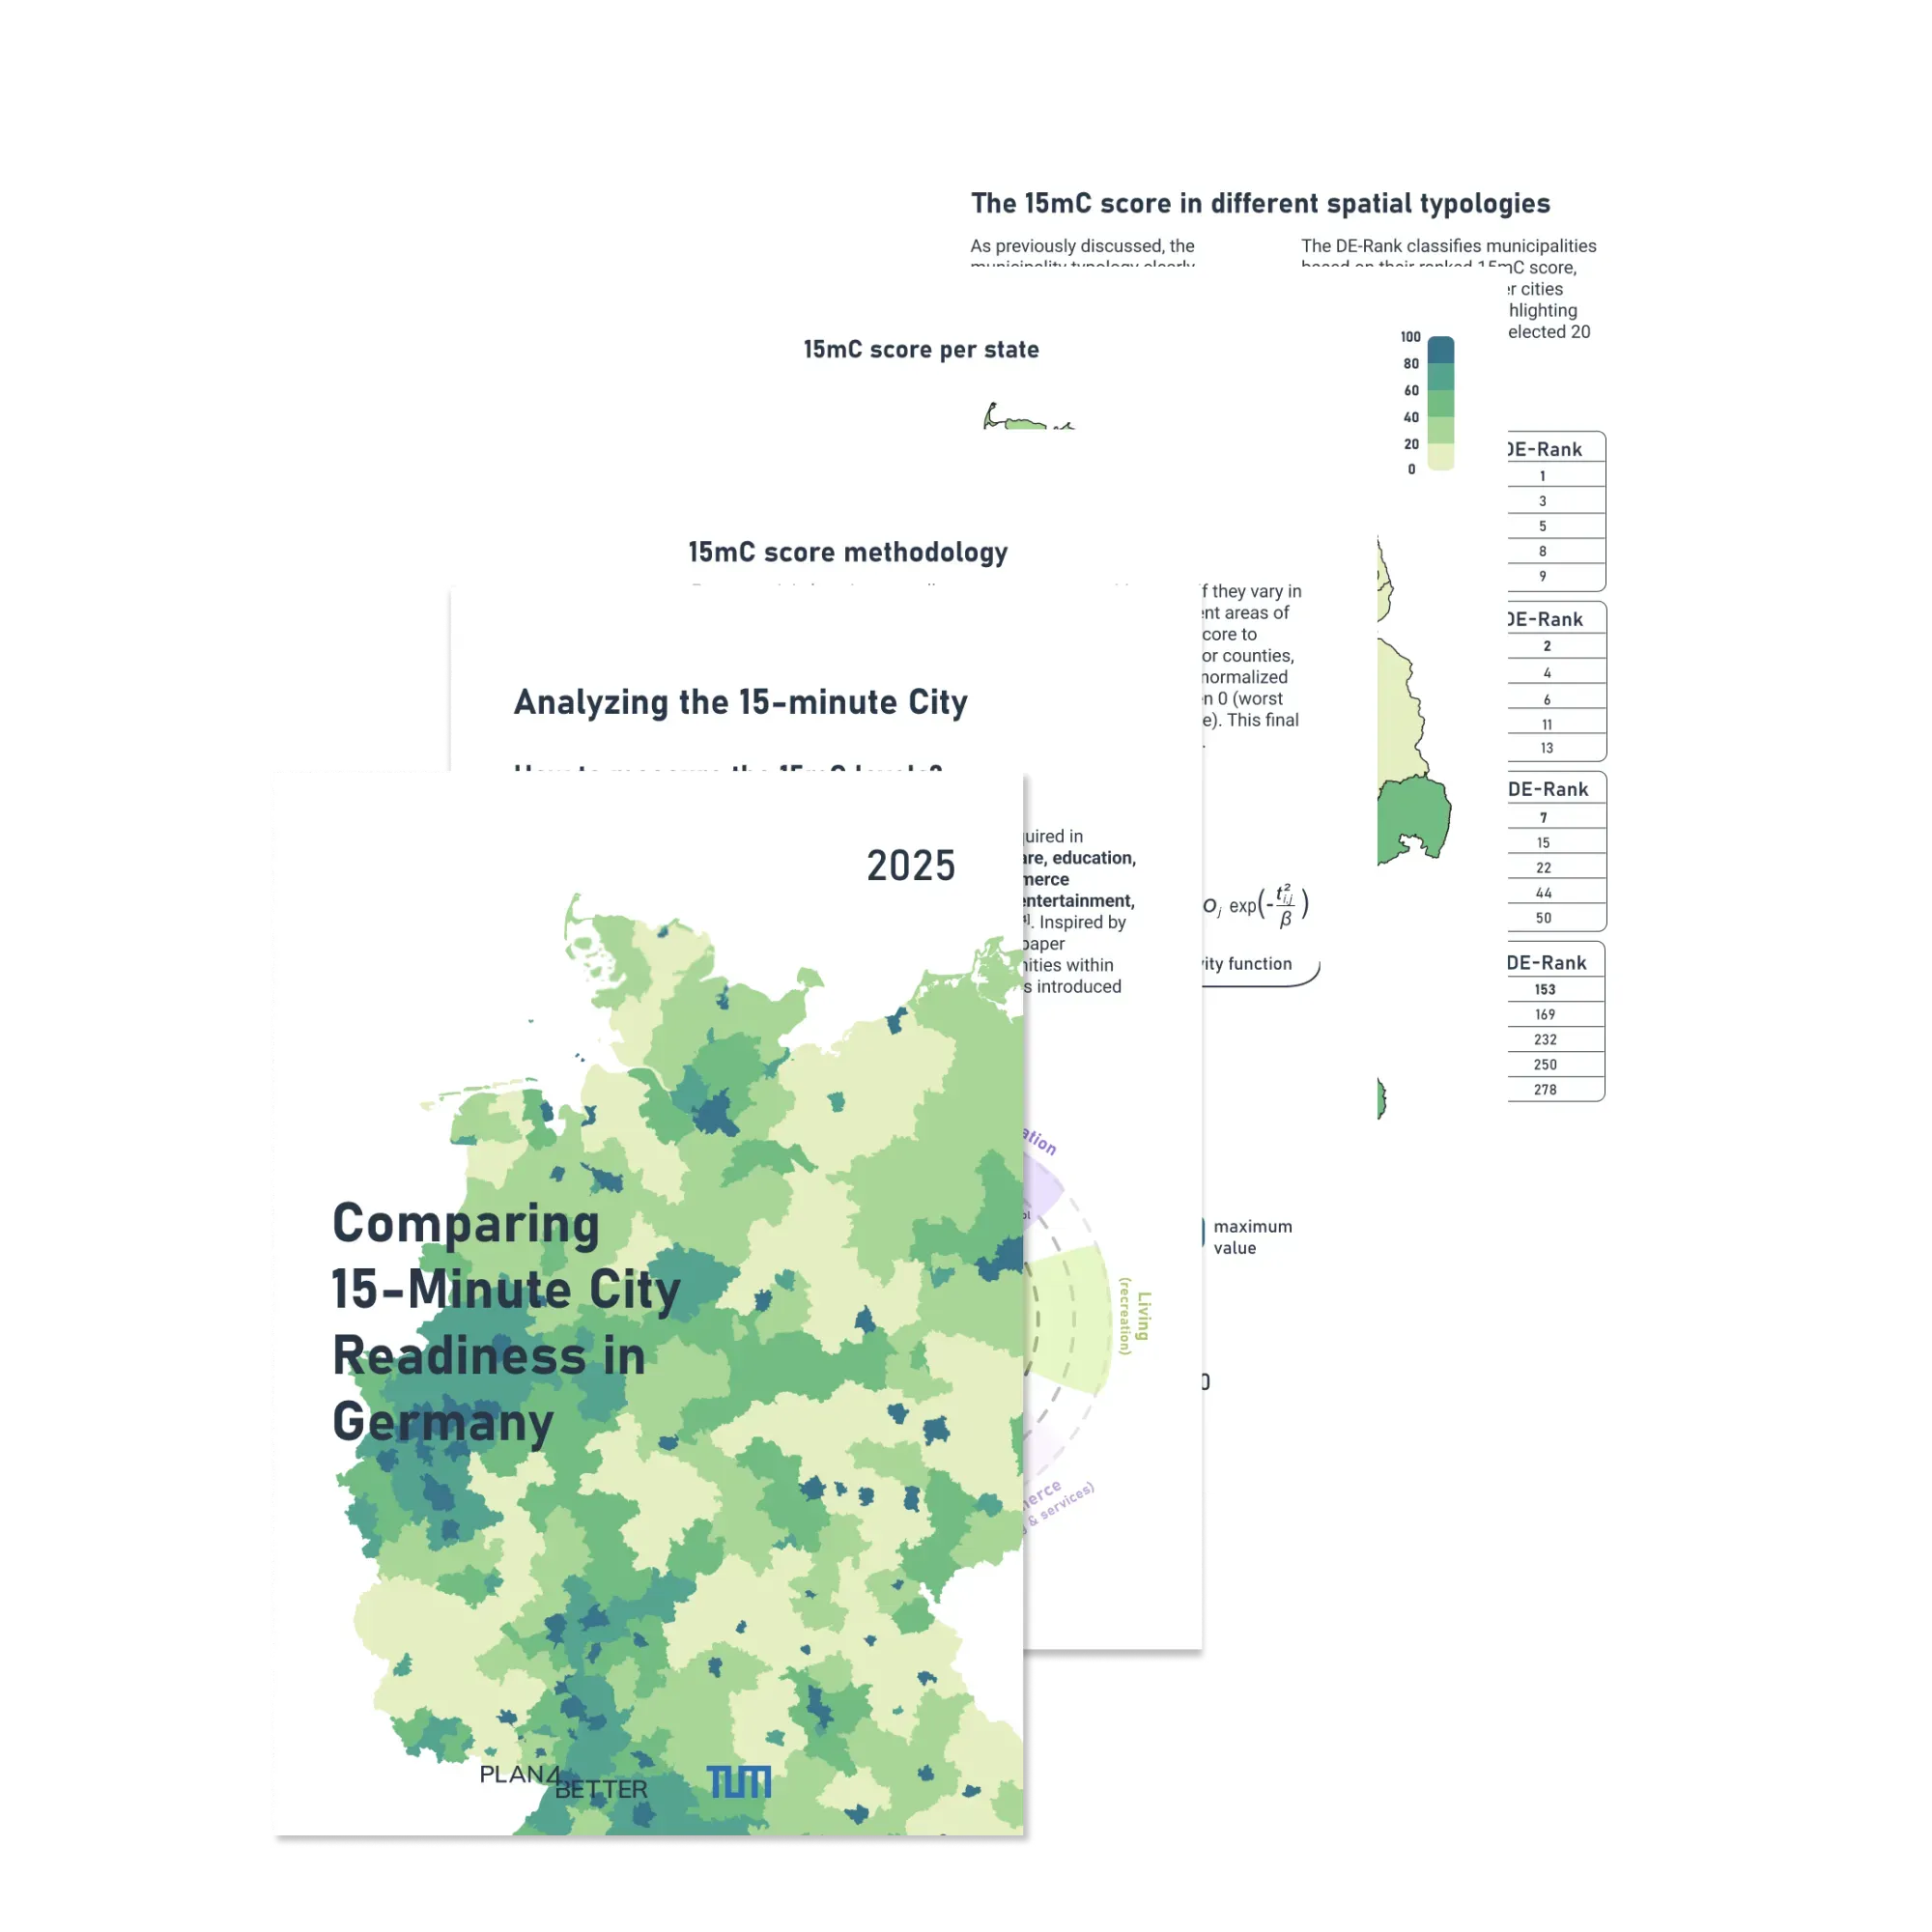
  • A 15-minute city score mapped for every municipality and state in Germany

    15-minute City Score across Germany

    Can you cover daily needs within a 15-minute walk? This map scores every municipality and state in Germany on the 15-minute city concept.

    Check the map

The difference

Why GOAT?

  • Planning indicators and GIS tools, ready and easy to use

    Gravity-based heatmaps, ÖV-Güteklassen, catchment areas, 15-minute-city scores: the accessibility indicators planning decisions rely on, ready to run with your parameters. Around them sits a full toolbox of GIS and data analysis tools, so you can join, filter and aggregate your own data without leaving the browser.

    Then save the whole thing as a workflow. When the data updates or a boundary changes, run it again. Same method, new result, no rebuilding.

  • A data catalog with AI-powered search

    Over 20,000 ready-to-use datasets: population, administrative boundaries, street networks, points of interest. Describe what you need and the catalog finds it, so you can start the analysis instead of procuring data first.

  • Ready to use, open by design

    Nothing to install. Built on open-source technologies and open standards, so your data and workflows stay portable.

  • Scalable

    From a single department to a cross-municipal platform for entire regions.

  • Proven in practice

    Used by cities, regional authorities and federal research institutions across Germany, Austria and Switzerland.

See how Hamburg is doing it

Cities and agencies are already running these analyses on live projects, at the scale their own networks demand.

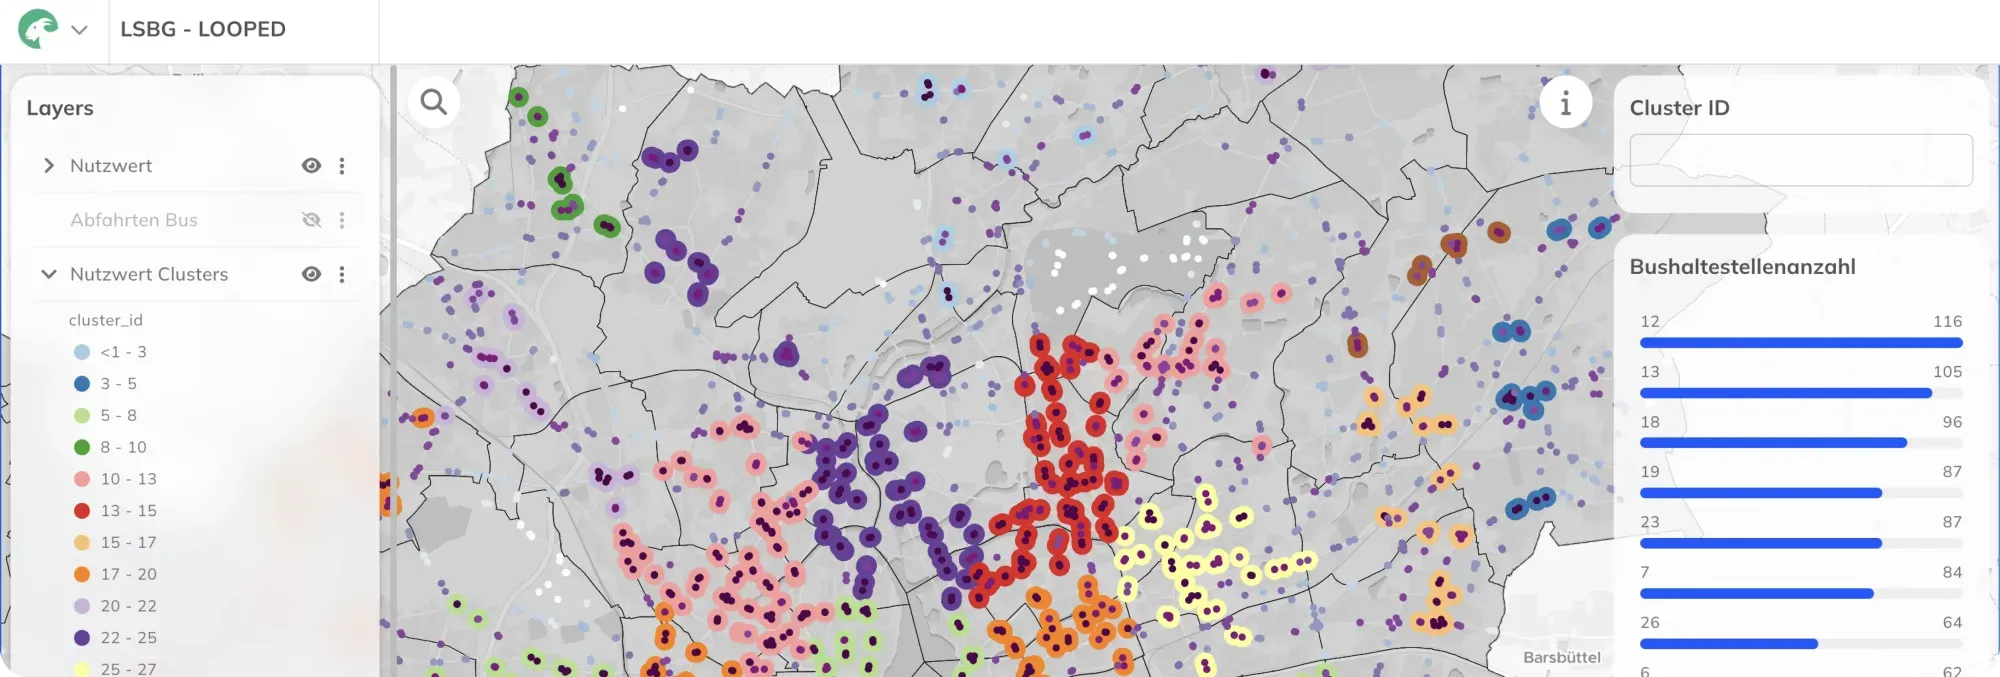
Location Analysis for Bus Stops in Hamburg with WebGIS GOAT

Location Analysis for Bus Stops in Hamburg with WebGIS GOAT

The Hamburg State Agency for Roads, Bridges and Waterways (LSBG) is tasked with systematically retrofitting approximately 2,400 bus stops for barrier-free access. The automated, standardized multi-criteria analysis required for this is being developed using the WebGIS GOAT.

Read the reference
Pages from the 15-Min City whitepaper

15-Min City Whitepaper

How reachable is daily life on foot? The method behind our 15-minute-city scores, the open data it runs on, and what it shows when applied to every municipality in Germany.

[object Object]

Fill out the form to download your free copy of the white paper

You can unsubscribe from these notifications at any time. For more information about unsubscribing, our privacy practices and how we protect and respect your privacy, please see our Privacy Policy.

This form is not connected yet — the download is not being delivered.

Ready to make sense of your data?

Join planners, organizations and cities using GOAT to make better decisions, faster. No GIS expertise needed.