
GOAT — The Open-Source WebGIS for Modern Spatial Analysis
Analyze data, compute accessibility indicators, create dashboards, and collaborate — all in one browser-based GIS platform.
overview
What is GOAT?
GOAT is a German open-source WebGIS platform for spatial analysis, accessibility modeling, and geospatial data visualization.
It enables planners, researchers, mobility experts, and public sector organizations to analyze spatial data, create dashboards, automate workflows, and collaborate on maps directly in the browser.
your data
Data Integration & Management
Import your own data, connect OGC services, and access a built-in catalog of ready-to-use datasets for geospatial data management in one centralized WebGIS platform.
Ready-to-Use Datasets
Access our Data Catalog including population statistics, administrative boundaries, street networks, and points of interest (POIs).
Integrate External Data
Upload your own datasets in multiple file formats or connect to OGC services such as WFS and WMS.
Manage all GIS Formats
Work with common GIS formats including GeoJSON, Shapefile, CSV, WMS, and other OGC services.
analysis
Spatial Analytics & GIS Indicators
Transform raw geospatial data into measurable insights in seconds. Use advanced GIS analytics, accessibility analysis, and planning indicators — all directly in your browser.
Compute Accessibility Analysis
Perform advanced accessibility analysis with catchments, 15-minute metrics, routing, heatmaps, and public transport indicators (e.g., Swiss ÖV-Güteklassen).
Run Core GIS Operations
Run powerful geospatial analysis tools including spatial joins, data filtering, aggregation, buffering, clipping, and multi-criteria evaluation directly in your browser.
Customize Map Layers
Control basemaps, layer colors, labels, and icons, including attribute-based styling and cartographic customization to produce clear and informative maps.
automation
Automated Spatial Workflows
Automate recurring spatial analysis and reduce manual work. Build workflows once, reuse them across projects, and ensure consistent and reproducible results — saving time and improving efficiency.
Build Automation Pipelines — No Code Required
Assemble analysis steps using an intuitive drag-and-drop workflow builder, allowing teams to automate spatial analysis without programming.
Build Once and Reuse Across Projects
Design a sequence of analysis steps once, then update inputs and parameters, and rerun to save time and keep results consistent.
Document and Share your Processes
Keep workflows transparent and well documented so they can be shared across teams, ensuring consistent methods and faster decision-making.
results
Dashboards, Printed Maps & Visual Analytics
Turn complex spatial analysis into clear, decision-ready insights — interactive or static. Link maps with charts and indicators to create spatial data visualizations tailored for planners, analysts, and stakeholders.
Create Dashboards with No Code
Build interactive GIS dashboards. Connect maps, indicators, and charts in real time to monitor performance and explore urban data.
Generate Print-Ready Maps
Create high-quality maps for reports and presentations. Using the atlas tool, generate map series at once with consistent cartographic design.
Public Sharing & Visual Reporting
Turn analysis into visual reports. Create charts, summaries, and map-linked stats to share insights with decision-makers, stakeholders, and the public.
teamwork
Real-Time Team Collaboration
Collaborate on spatial projects in real time within a multi-user WebGIS environment — without duplicated data or disconnected tools.
Share Work across Teams
Share maps, datasets, workflows, and dashboards with colleagues so everyone works with the same information in a centralized platform.
Work Simultaneously on Projects
Work simultaneously with your team on shared maps, layouts, workflows, and dashboards keeping analyses aligned and maintaining data consistency.
Manage Roles and Permissions
Assign roles and control access across your organization to ensure teams collaborate efficiently while keeping data secure.
why GOAT
A Trusted WebGIS Platform for Digital Sovereignty
Developed in Germany, GOAT is a robust and innovative GIS platform designed for modern spatial analysis and collaborative decision-making. Built on open standards and open-source technologies, GOAT supports digital sovereignty, secure data infrastructure, and transparent geospatial workflows.
Web-Based, Modern & High-Performance
GOAT runs entirely in the browser and combines powerful spatial analysis features with a modern, intuitive user interface. Teams can analyze, visualize, and share spatial data quickly, without complex desktop GIS workflows.
Developed & Hosted in Germany
GOAT is developed by an innovative, Germany-based team and hosted on certified servers in Germany. This ensures secure data handling, long-term reliability, and full compliance with European data protection standards.
Open-Source, Flexible & Compatible
Built on open standards and open-source technologies, GOAT integrates easily with existing geospatial infrastructures. Connect OGC services, internal datasets, or external data platforms and continue working with the systems you already use.
Real-World Applications
- Healthcare
- Cities & Government
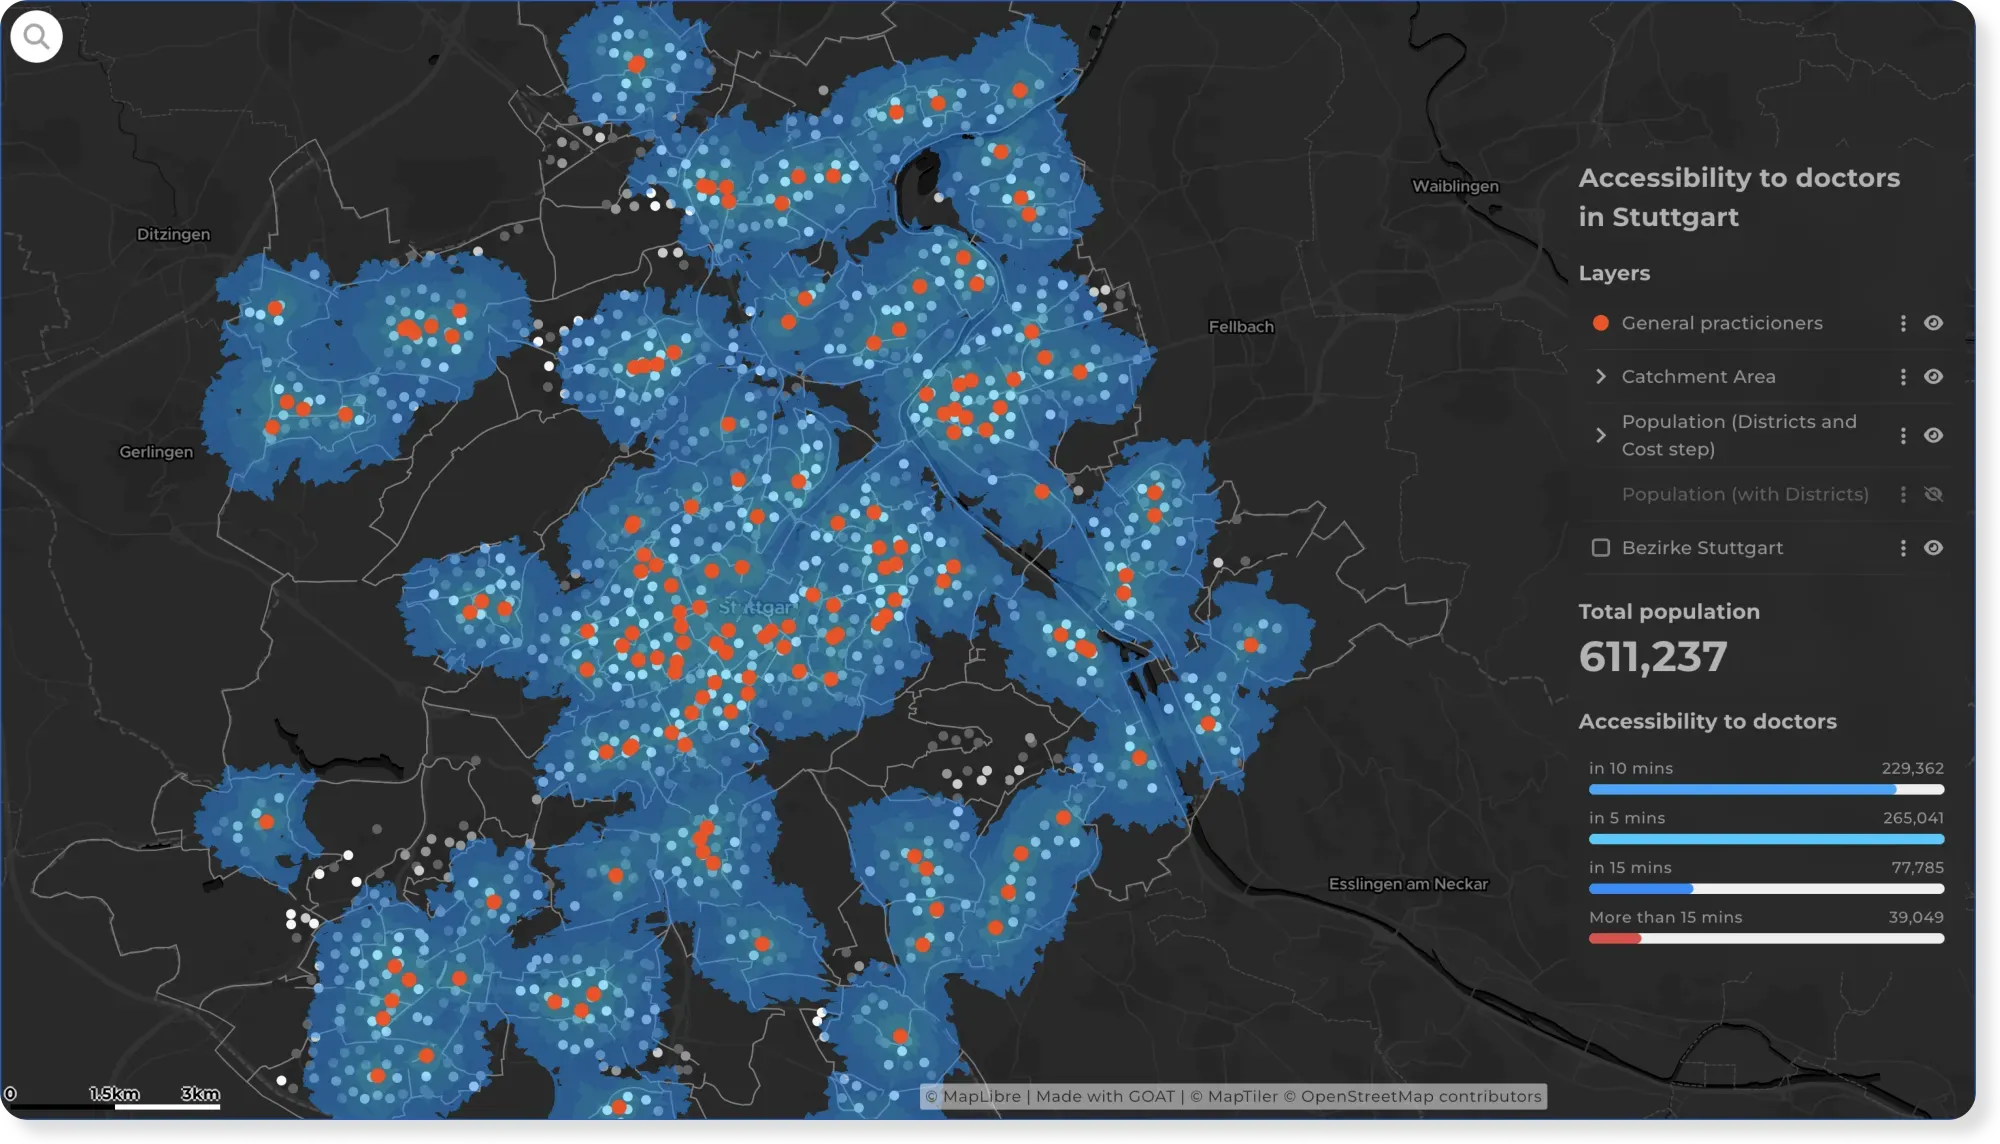
How Easily Can Stuttgart Residents Reach a Doctor?
Reaching a doctor shouldn't depend on where you live. This map shows travel time to GPs across Stuttgart, reveals the areas left underserved, and suggests where new practices should go.
See the map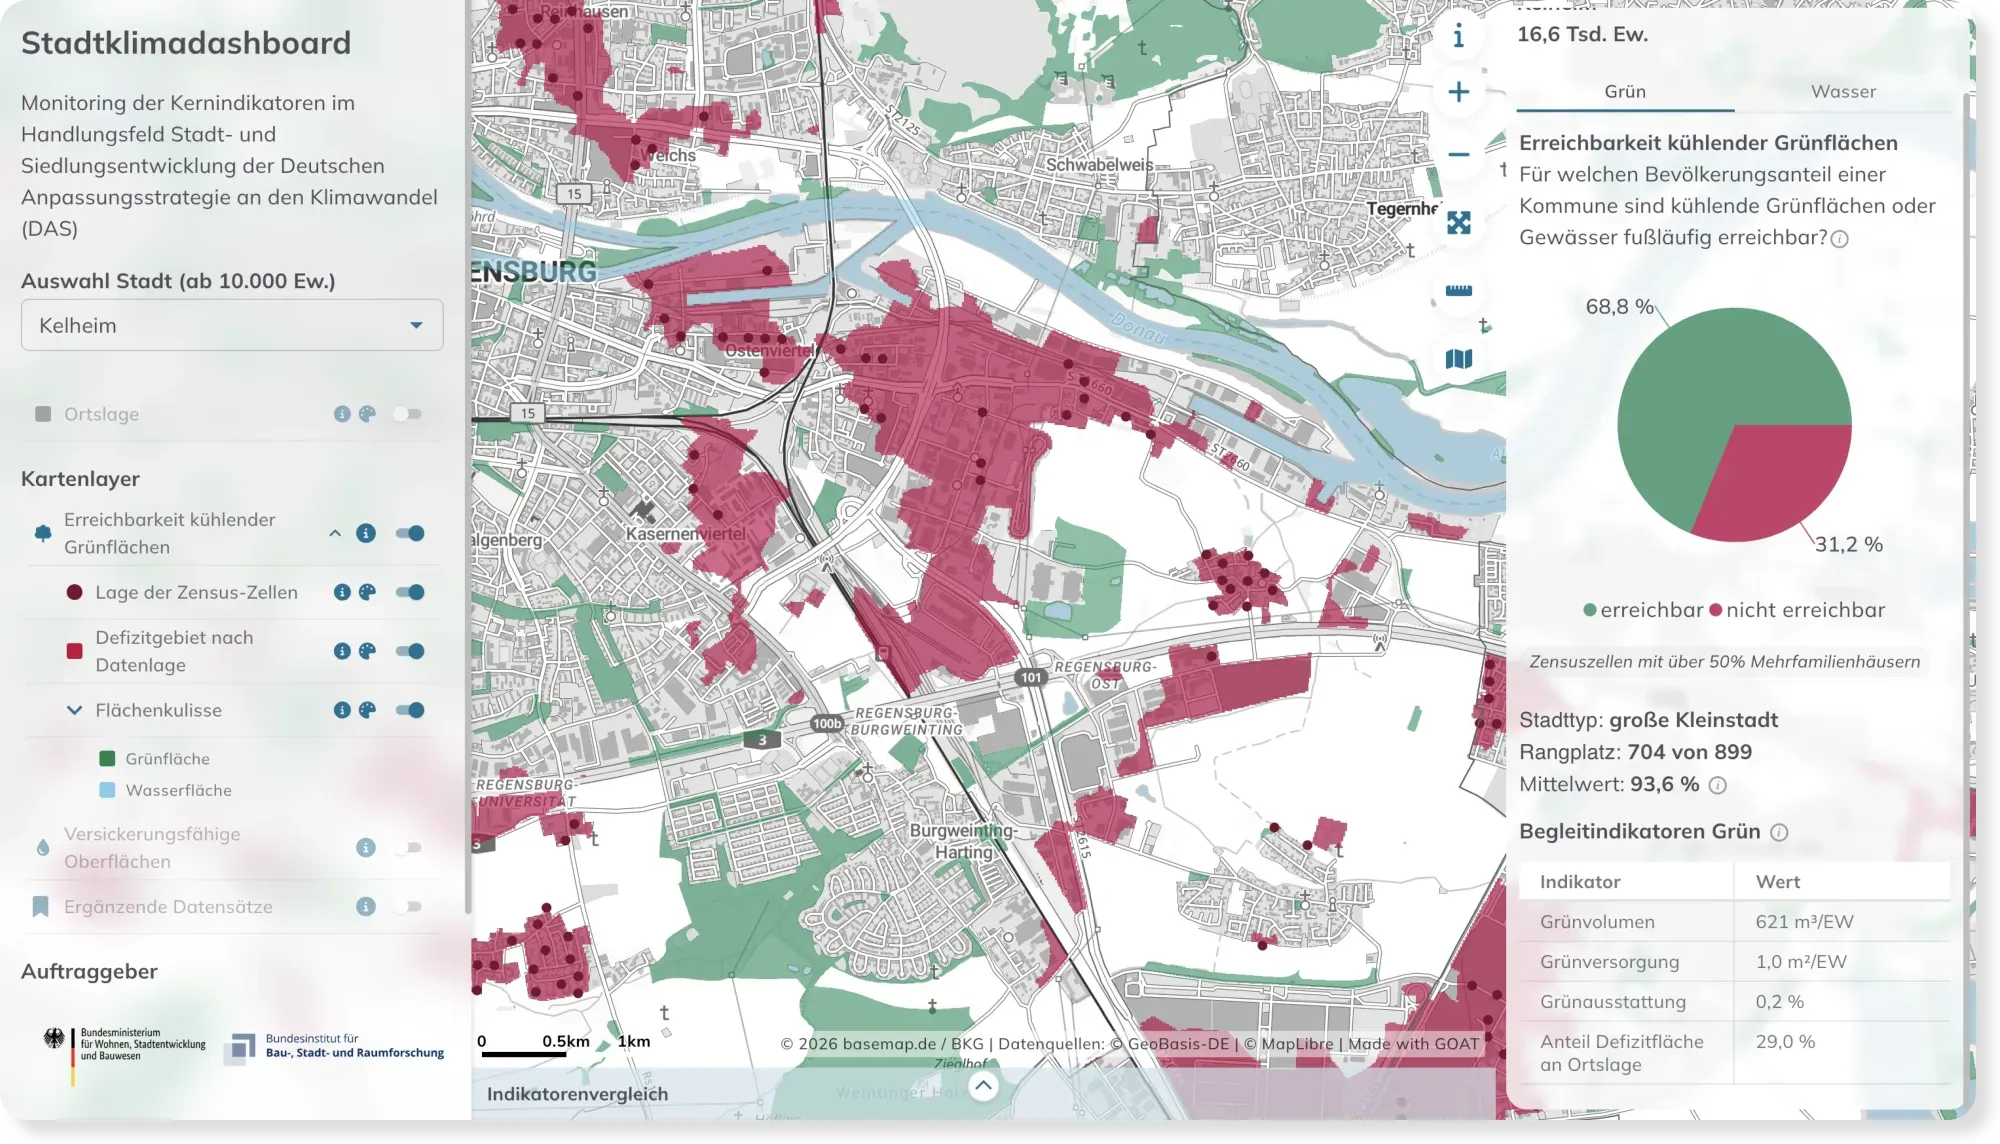
- Sustainability & Climate Risk
Stadtklimadashboard: Monitoring Climate Adaptation Across Germany's Cities
How ready are Germany's cities for extreme heat? The Stadtklimadashboard maps access to cooling green space and permeable surfaces for every German city over 10,000 inhabitants.
See the map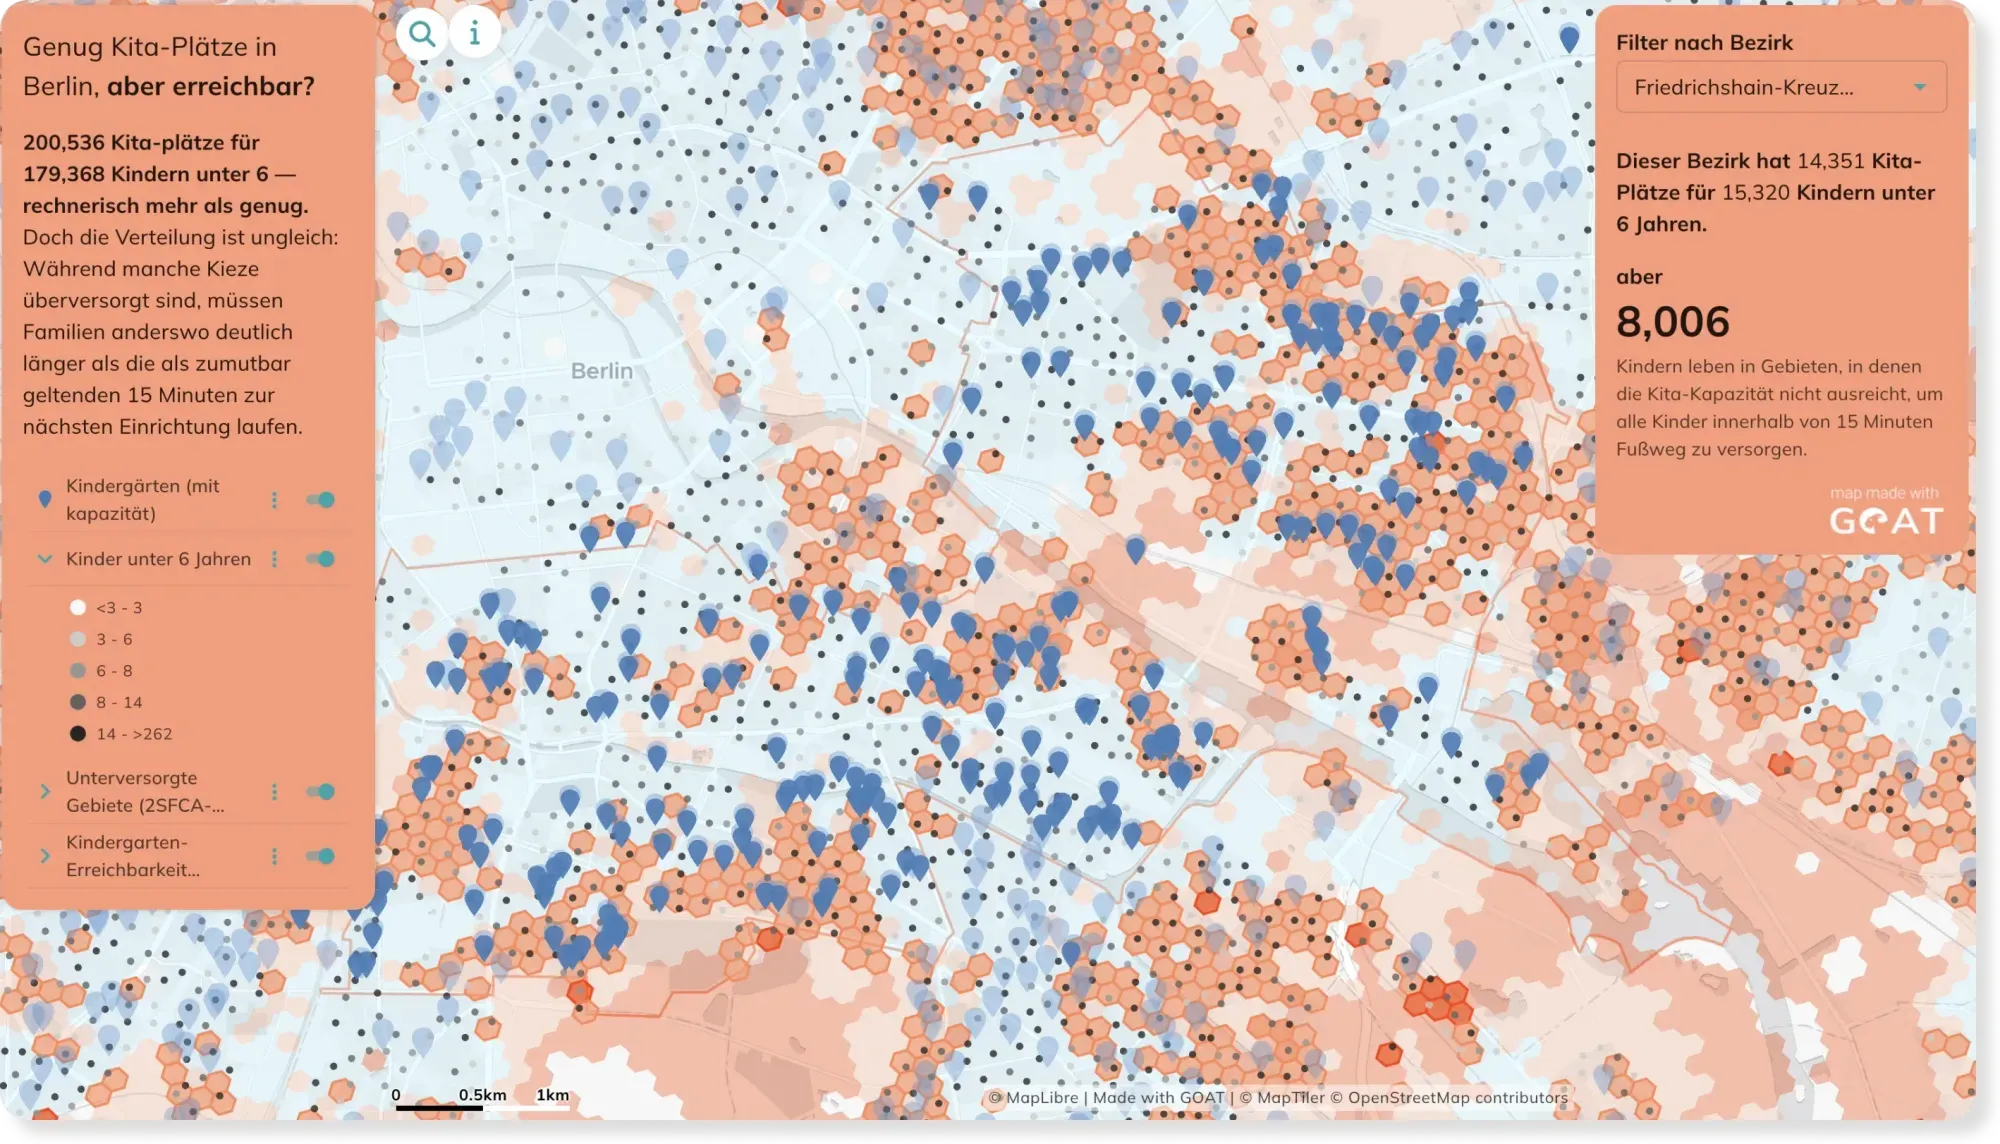
- Mobility Planning
- Cities & Government
Kindergarden accessibility in Berlin: Distance and Capacity combined
A kindergarden five minutes away doesn't help if every place is already taken. This map goes beyond simple distance and factors in capacity too — showing where families are truly cared for.
See the map
learn GOAT
Documentation, Tutorials & Training
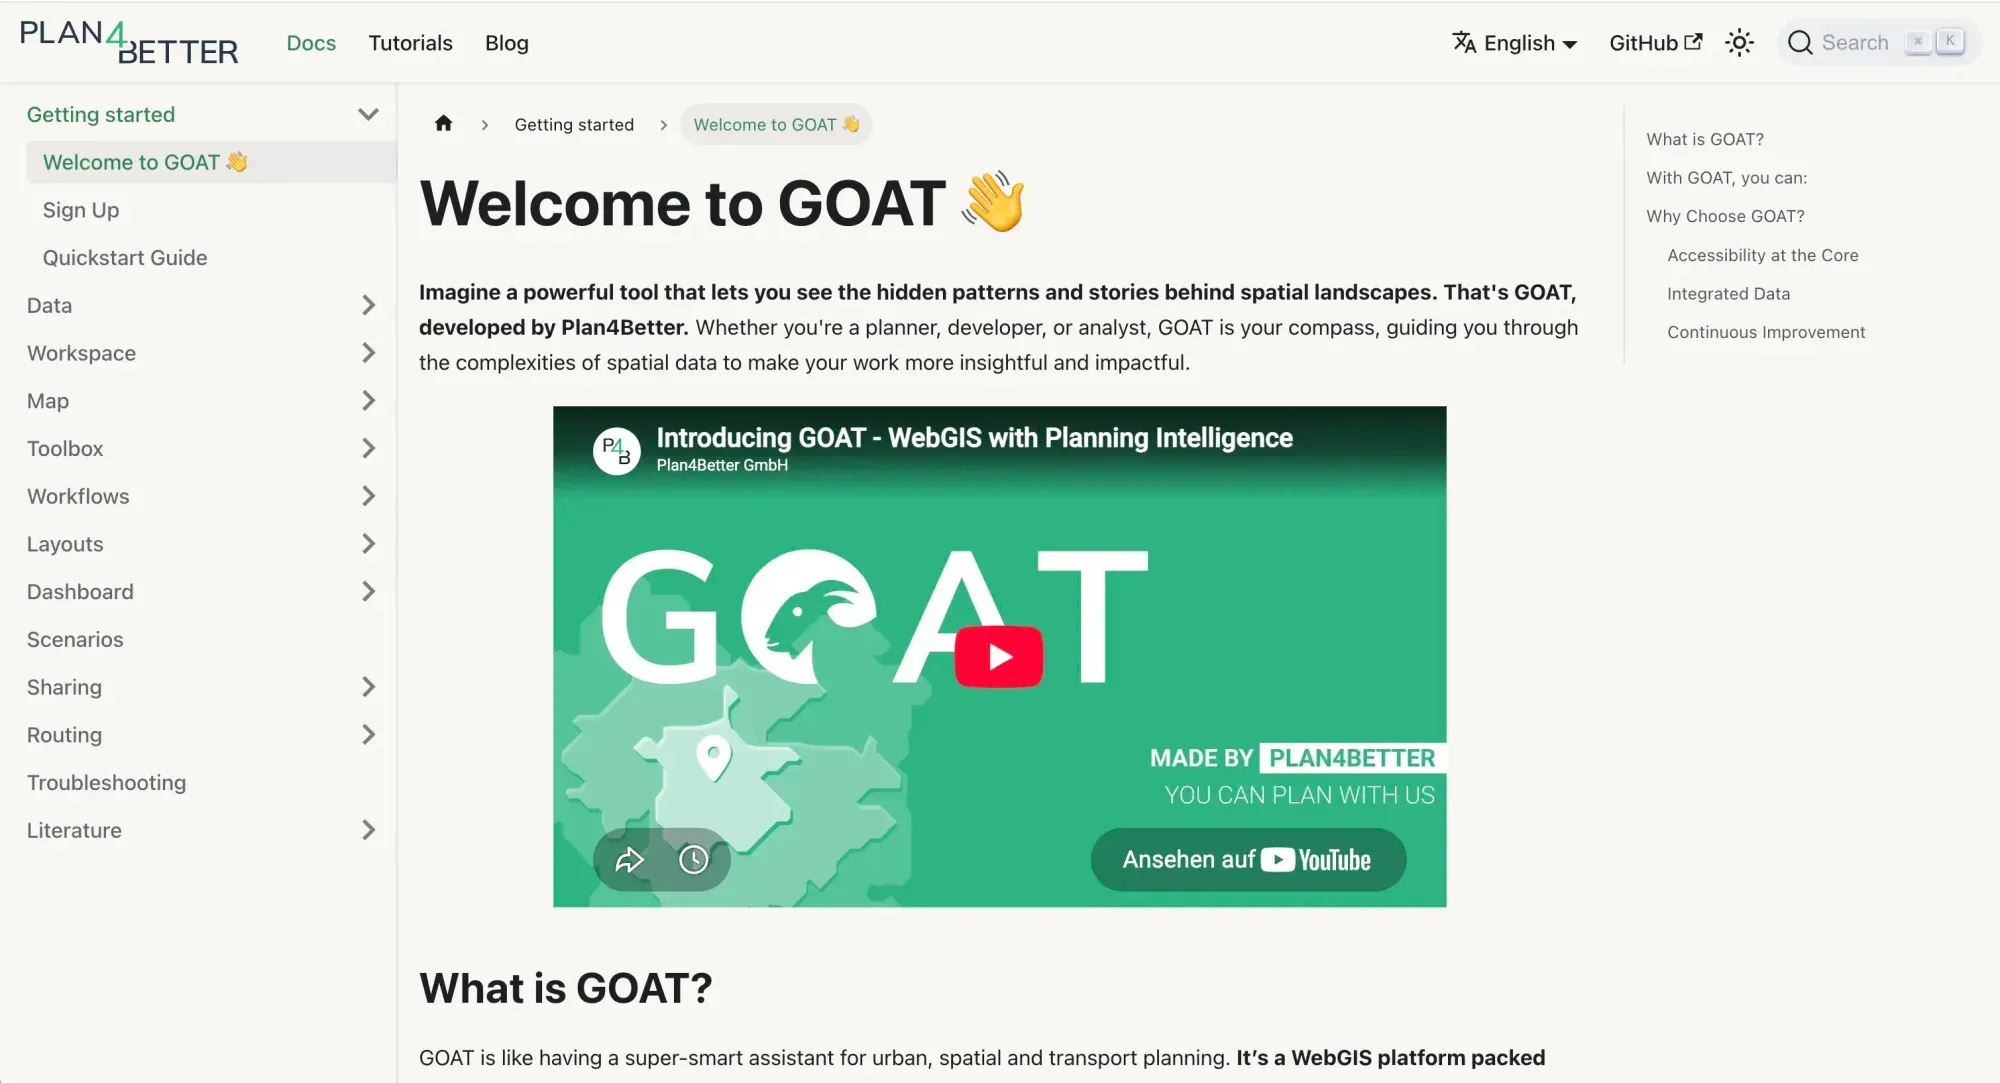
Our comprehensive documentation, tutorials, and training resources help you learn GOAT quickly and start building powerful spatial analyses and WebGIS applications.
Docs
Detailed explanations, step-by-step guidelines and technical insights into GOAT.
Read the docs (opens in a new tab)
Videos
Video tutorials on the key tools you can use within GOAT.
Watch the tutorials (opens in a new tab)
Frequently asked questions
What is GOAT?
GOAT is a WebGIS platform that enables spatial analysis, accessibility modeling, GIS dashboards, and collaborative mapping directly in the browser.
What is a WebGIS platform?
A WebGIS platform allows users to analyze, visualize, and share geospatial data directly in the browser without installing desktop GIS software.
What can you do with GOAT?
With GOAT you can:
- Analyze spatial accessibility and infrastructure coverage
- Combine demographic, mobility, and geographic datasets
- Build GIS dashboards and visual reports
- Create automated spatial workflows
- Collaborate on maps and datasets in real time
What types of analysis can be performed in GOAT?
GOAT supports spatial analysis tools including accessibility modeling, catchment analysis, spatial joins, routing analysis, and indicator-based evaluation.
Can teams collaborate in GOAT?
Yes. GOAT supports real-time collaboration, shared datasets, co-editing of maps and dashboards, and role-based access control.
What data formats does GOAT support?
GOAT supports common geospatial formats such as GeoJSON, Shapefile, CSV, and OGC services including WMS and WFS.
Ready to make sense of your data?
Join planners, organizations and cities using GOAT to make better decisions, faster. No GIS expertise needed.