
Back to the Gallery Map Gallery
Stadtklimadashboard: Monitoring Climate Adaptation Across Germany's Cities
How ready are Germany's cities for extreme heat? The Stadtklimadashboard maps access to cooling green space and permeable surfaces for every German city over 10,000 inhabitants.
A heatwave doesn’t hit a city evenly. A shaded, green street stays liveable; a sealed, treeless one turns dangerous — especially for small children and older people. The Stadtklimadashboard makes that difference measurable for every German city above 10,000 inhabitants. Built for the federal government as part of the BBSR’s ExWoSt programme, it calculates two core indicators nationwide and comparably: how easily residents can reach cooling green spaces, and how much of a city’s surface can still soak up water. From these it pinpoints the inner-city hotspots where climate adaptation matters most. From 2027 it will feed the federal climate-adaptation monitoring — and, like the methods and datasets behind it, it’s built open: open source, open data, reusable by any municipality. Plan4Better develops the dashboard as part of the project consortium led by the Leibniz IÖR, with LUP and bauchplan.
More maps to explore
- Energy
- Sustainability & Climate Risk
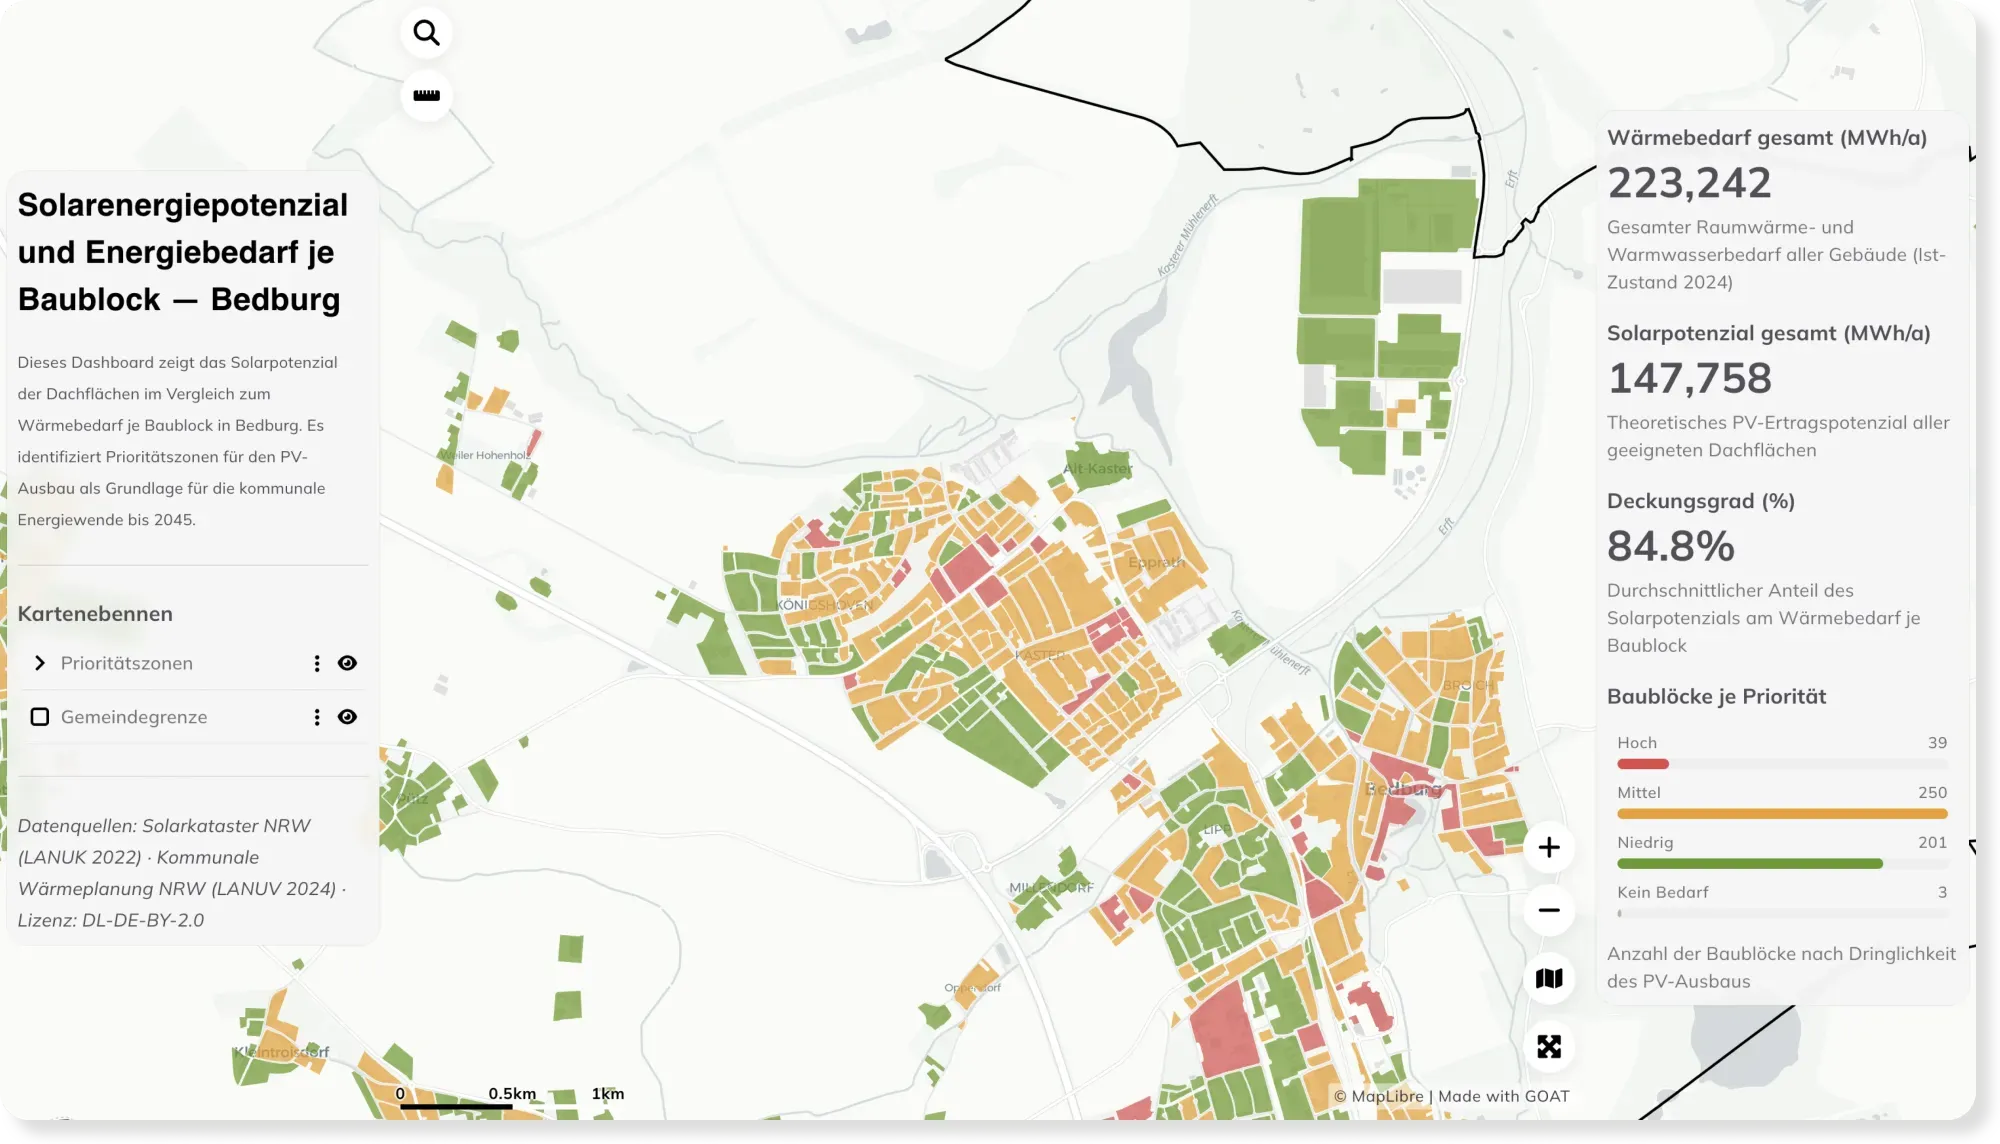
Rooftop Solar Potential vs. Energy Demand per Block — Bedburg
How much energy could a city's rooftops cover? This dashboard compares rooftop solar potential with heat demand per block in Bedburg, revealing priority zones for solar expansion.
See the map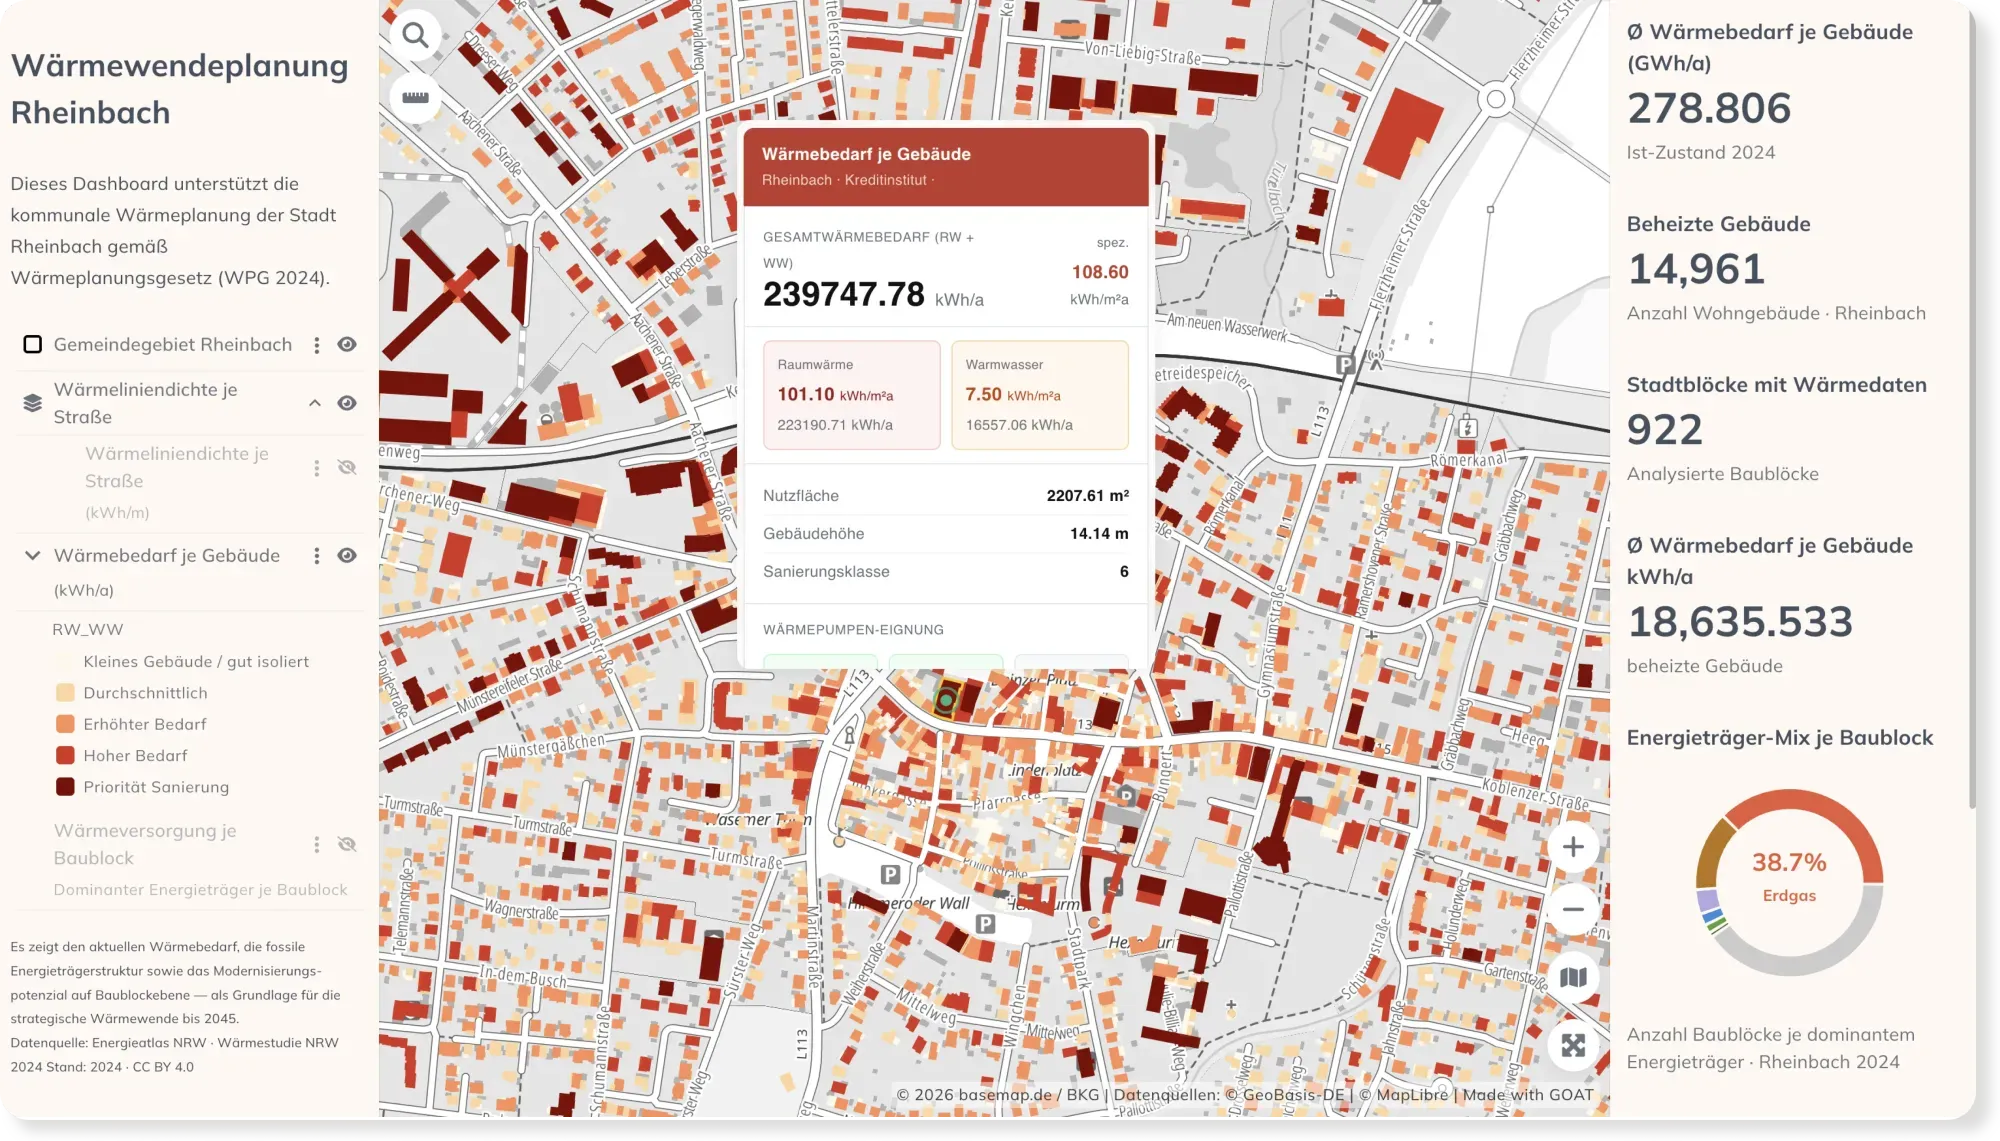
- Energy
- Sustainability & Climate Risk
- Cities & Government
Municipal Heat Planning: Heat Demand & Retrofit Priorities in Rheinbach
Germany's Heat Planning Act gives every municipality a deadline to plan its heat transition. This dashboard maps building-level heat demand, the energy mix, and retrofit priorities for Rheinbach.
See the map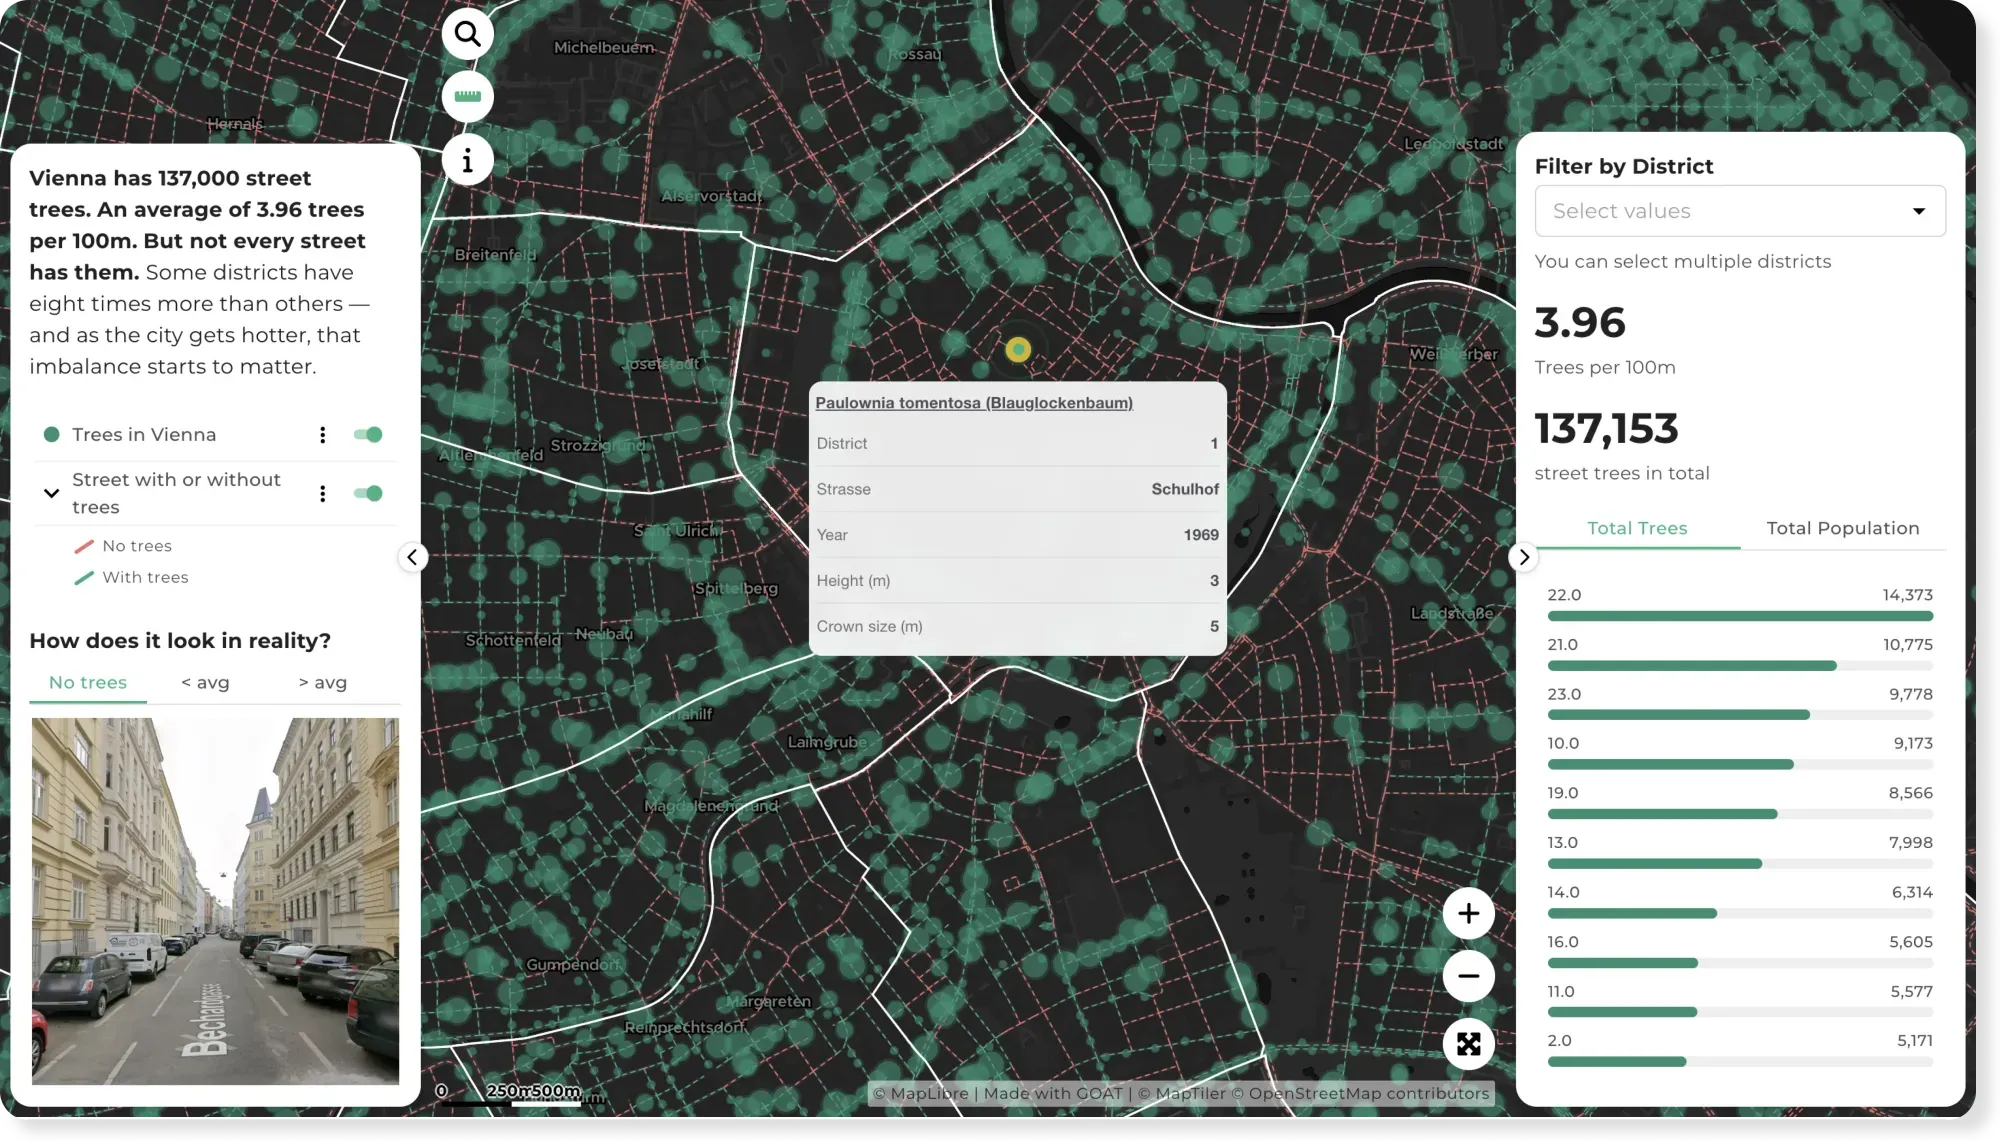
- Sustainability & Climate Risk
- Cities & Government
Vienna's 137,000 Street Trees — and Where the Shade Runs Out
Vienna has around 137,000 street trees — but some districts have eight times more than others. This map shows where the street canopy gives shade, and where it doesn't.
See the map
Ready to make sense of your data?
Join planners, organizations and cities using GOAT to make better decisions, faster. No GIS expertise needed.