Plan4Better

Industries

Sustainability & Climate Risk

Climate change is reshaping how cities plan — from heat adaptation and green space provision to sustainable mobility and equitable access. GOAT supports planners, researchers, and public authorities in developing data-driven strategies for climate adaptation and sustainable urban development, from neighbourhood scale to national monitoring.

GOAT dashboards for climate adaptation and sustainable urban planning
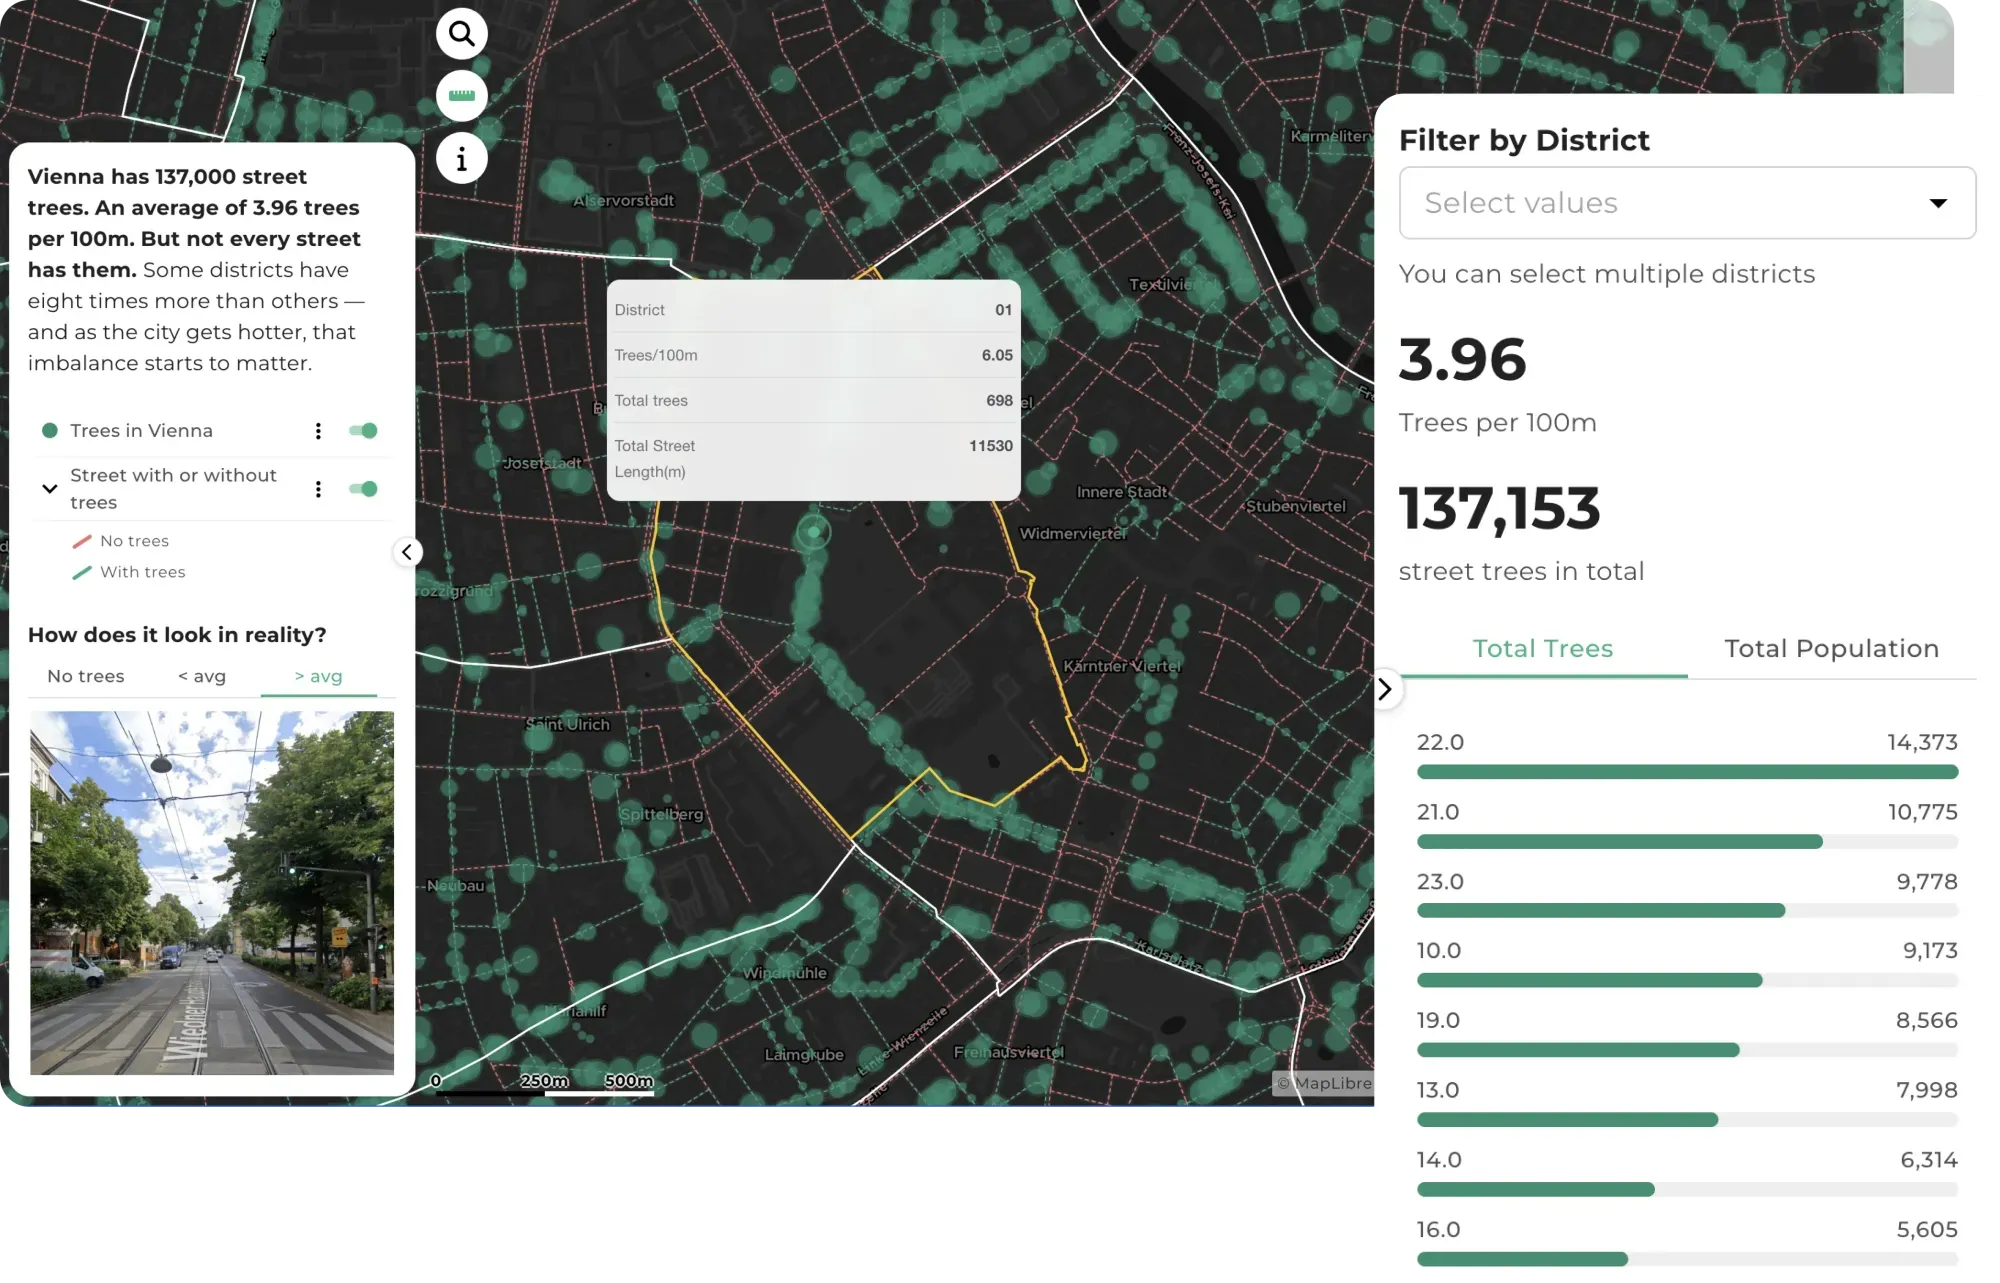
Street trees analysis created in GOAT

Plan Green Infrastructure for Heat Resilience

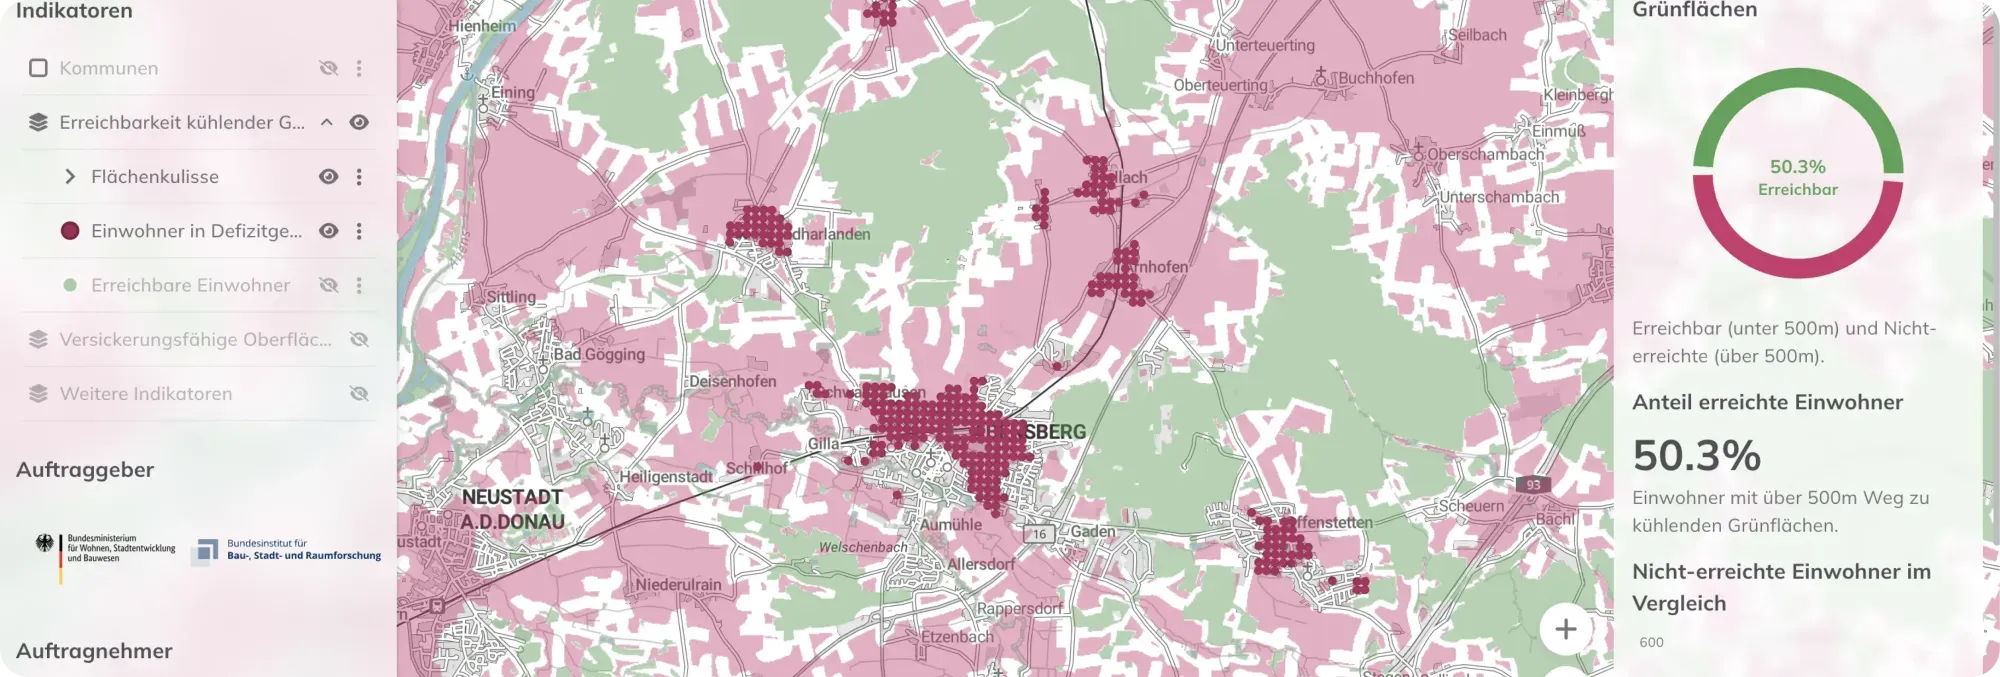
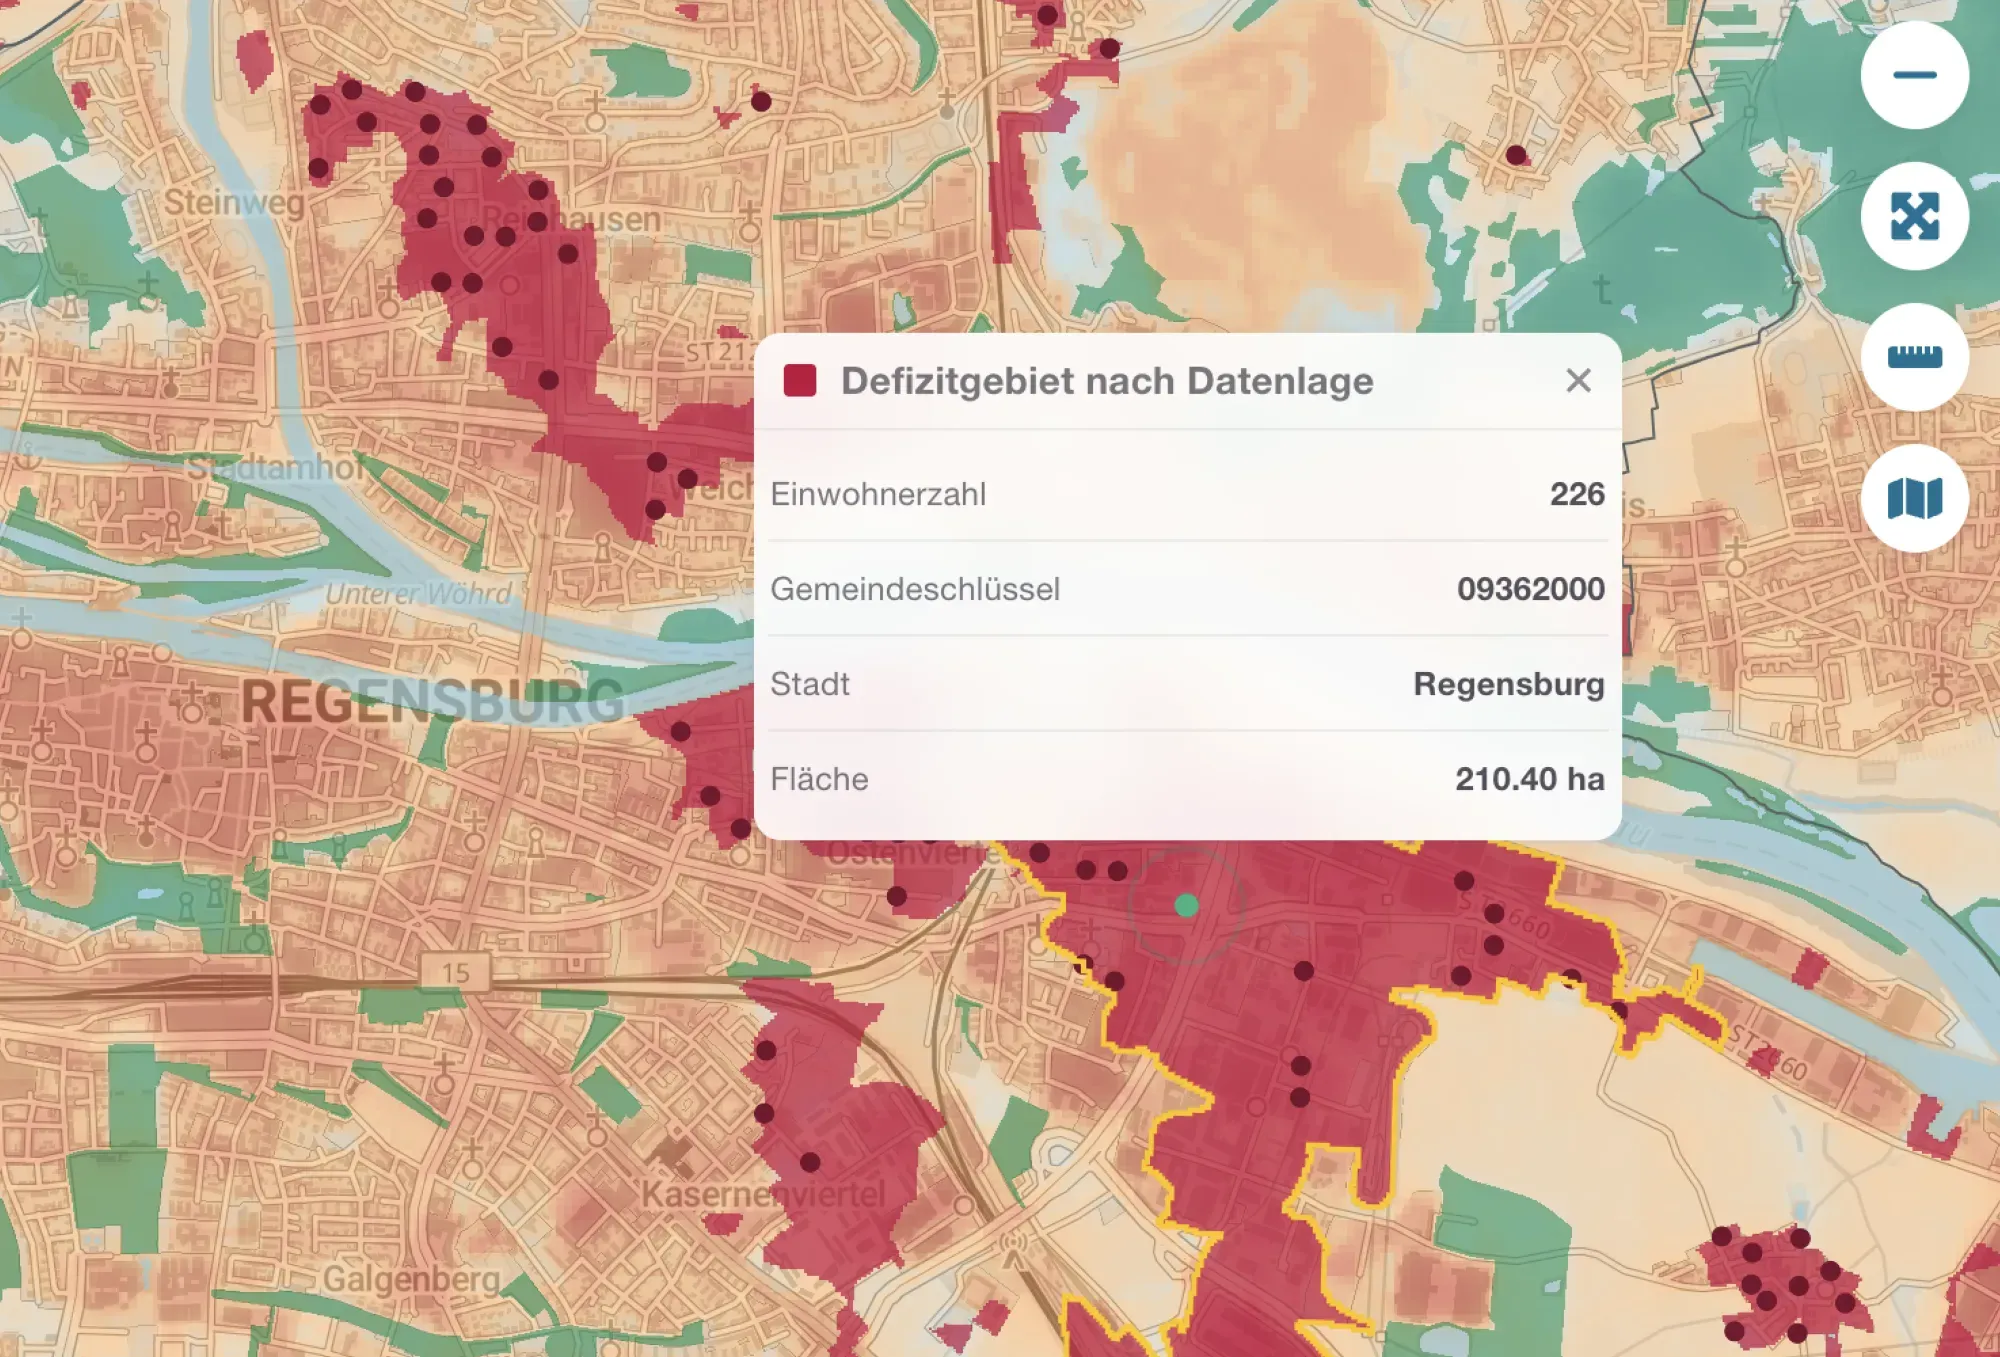
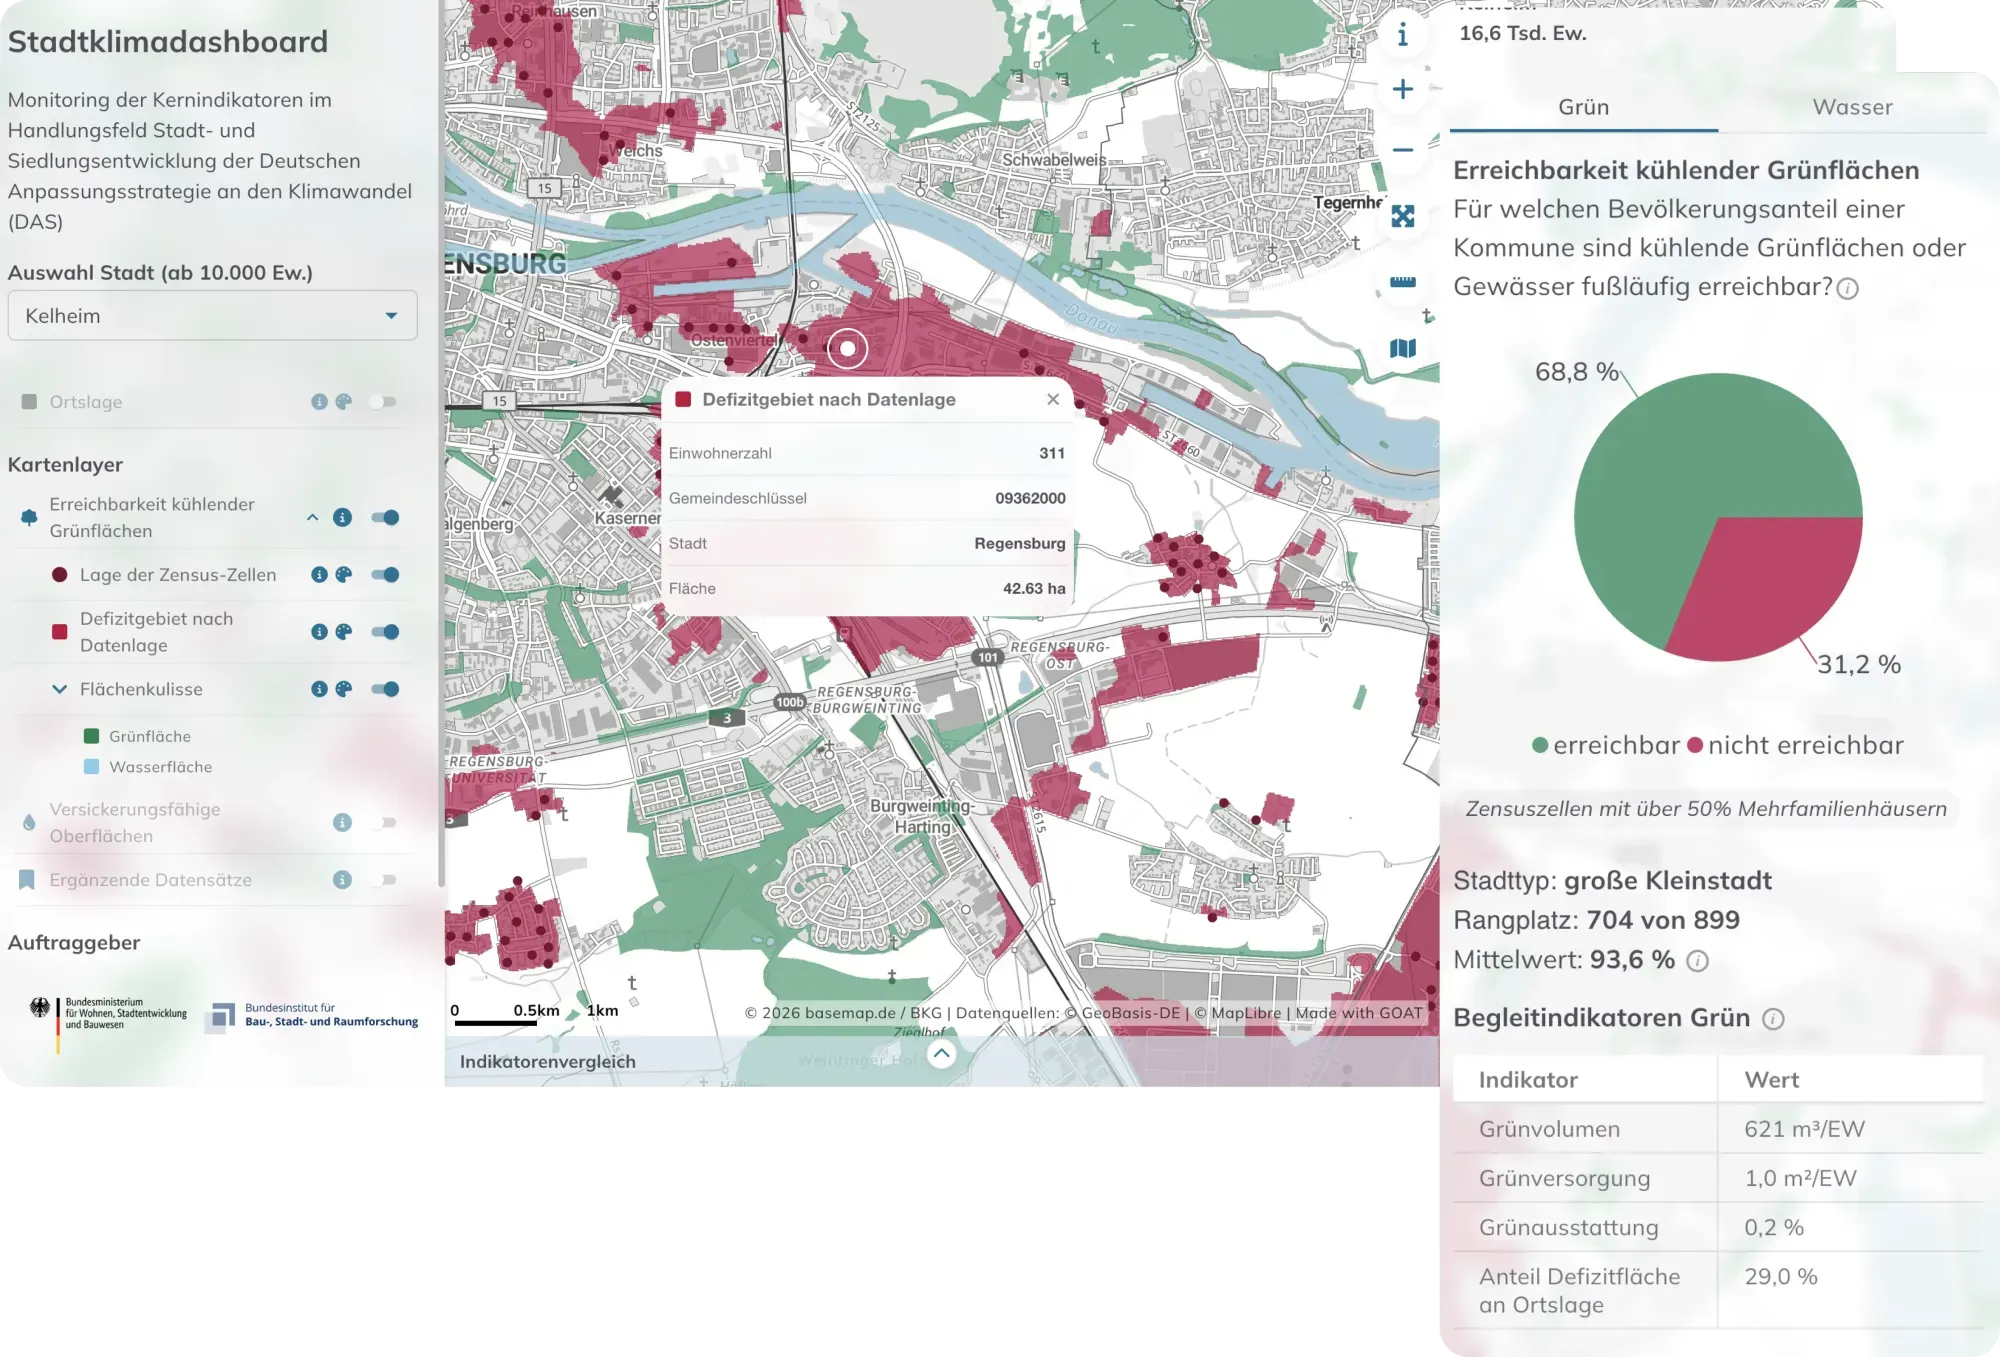
Assess how well residents can reach cooling green spaces — parks, urban forests, and water bodies — on foot or by bicycle, with particular attention to heat-vulnerable populations such as the elderly and children. GOAT's accessibility indicators support the planning and prioritisation of green infrastructure investments in the context of urban heat island mitigation — as demonstrated in Plan4Better's Stadtklimadashboard project for the Federal Institute for Research on Building, Urban Affairs, and Spatial Development (BBSR).
Climate adaptation monitoring dashboard with green space and surface indicators in GOAT

Monitor Climate Adaptation Progress with Spatial Dashboards

Develop interactive WebGIS dashboards that visualise nationally comparable climate adaptation indicators — such as accessibility to cooling green spaces and permeable surface coverage — to support continuous monitoring of urban climate resilience. GOAT's dashboard and reporting capabilities enable municipalities, state governments, and federal agencies to track progress against climate adaptation strategies and communicate results to stakeholders.

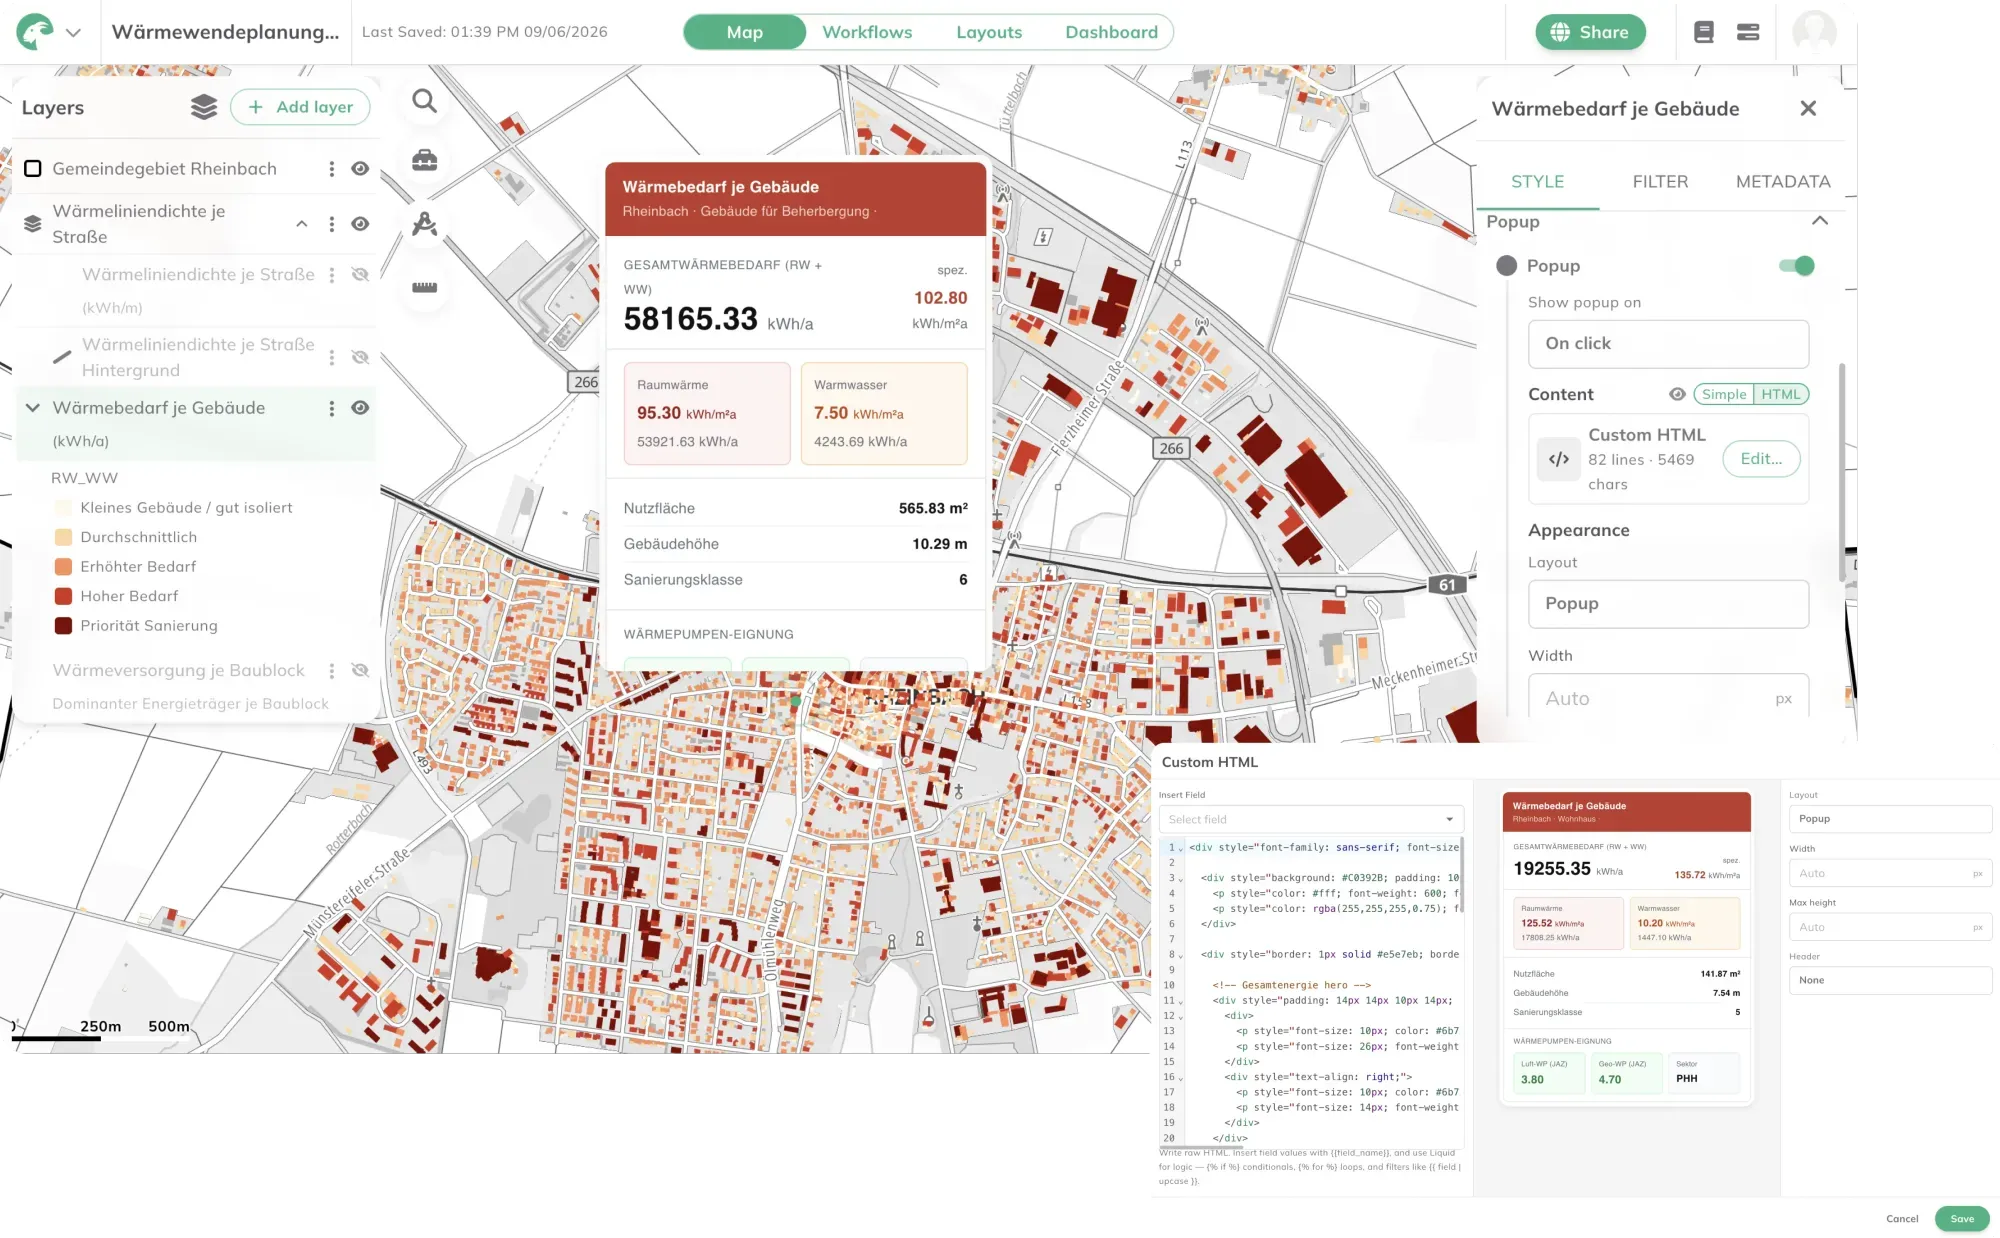
Municipal heat planning presented as an interactive map in GOAT

Present Sustainability Analyses & Planning Results as Interactive Maps

Present climate adaptation analyses and sustainability indicators as interactive maps and dashboards — for use in municipal climate action plans, funding applications, public participation processes, or reporting to regional and federal authorities. GOAT makes complex environmental data accessible and visually compelling for non-specialist audiences including politicians, citizens, and investors.

Maps made with GOAT

Real analyses built by planners, researchers, and cities — explore what’s possible before you start your own.

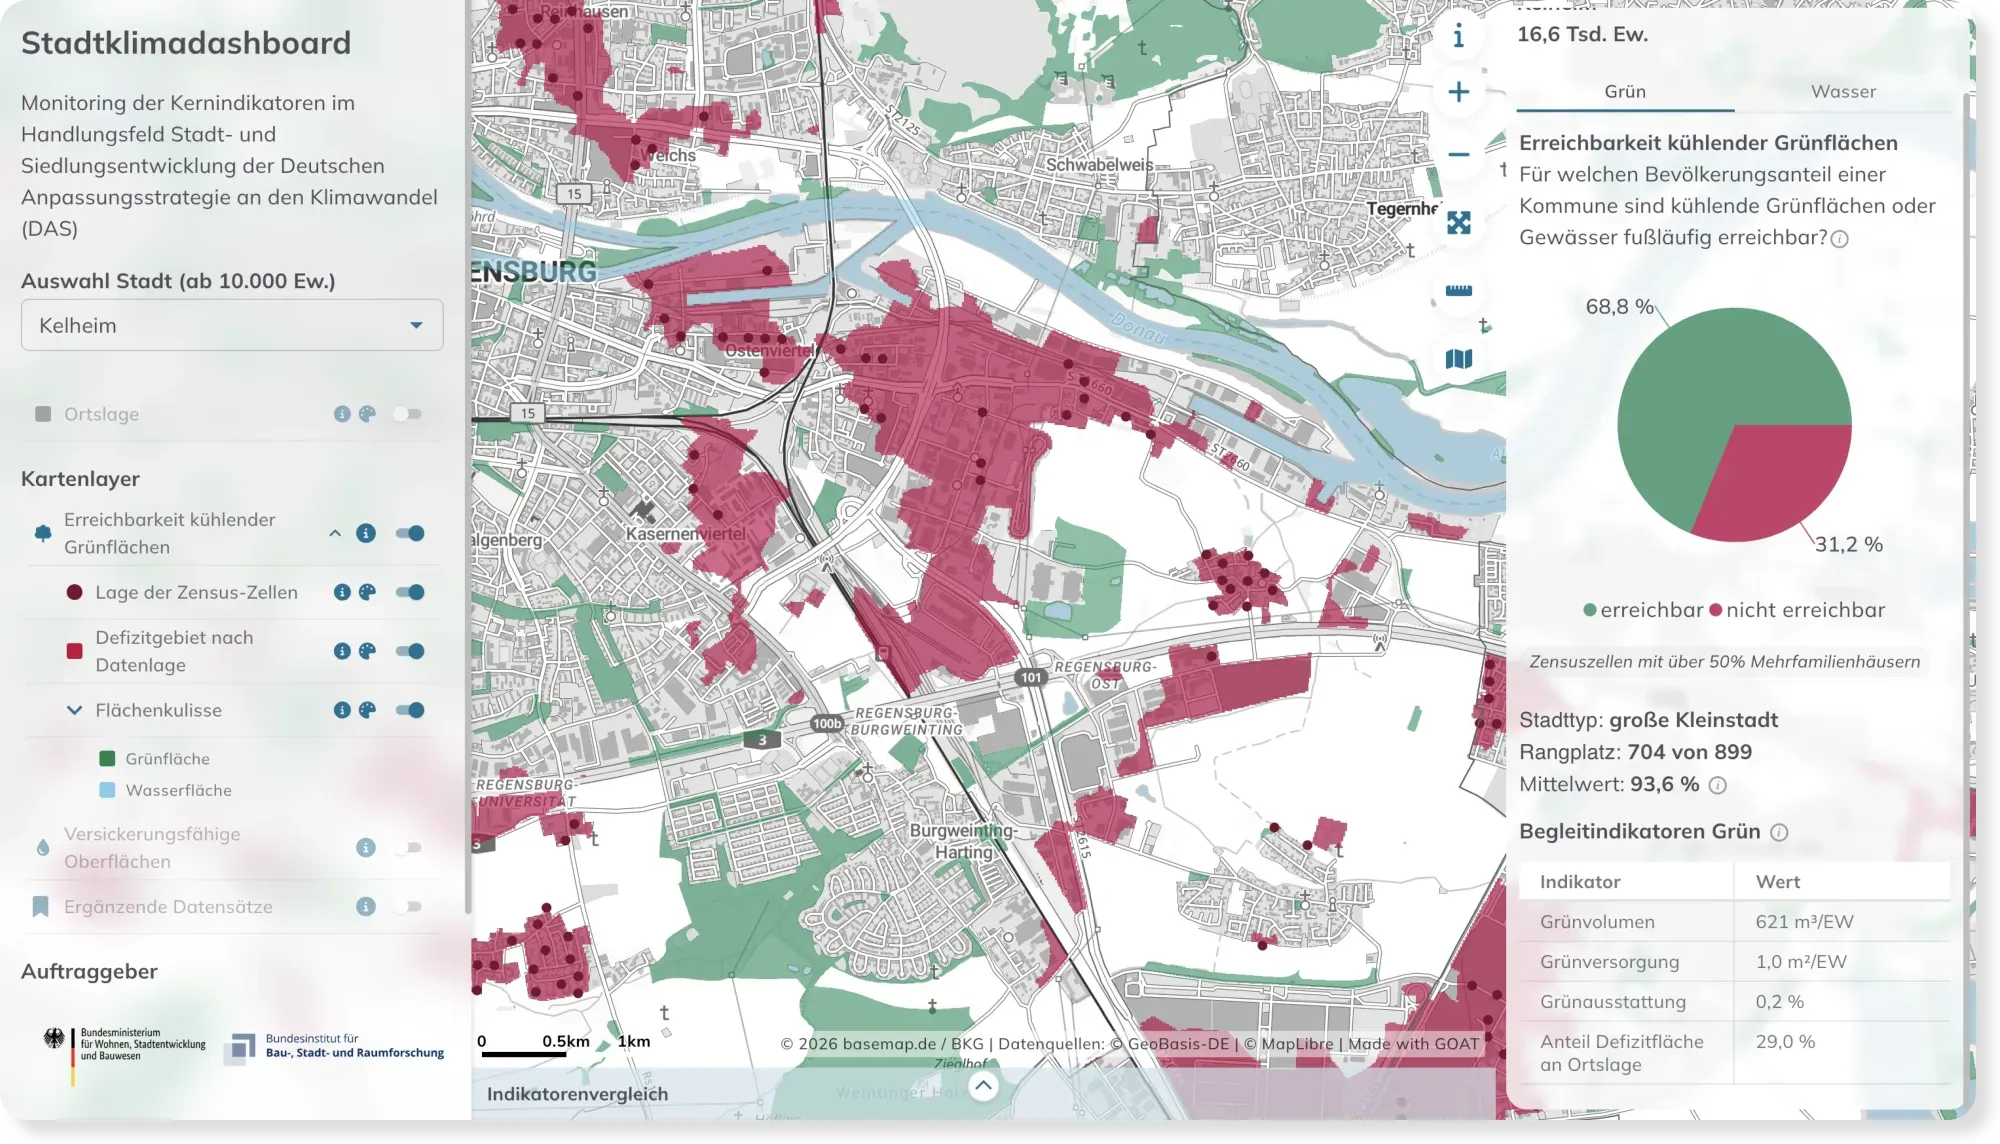
  • Stadtklimadashboard: Monitoring Climate Adaptation Across Germany's Cities

    Stadtklimadashboard: Monitoring Climate Adaptation Across Germany's Cities

    How ready are Germany's cities for extreme heat? The Stadtklimadashboard maps access to cooling green space and permeable surfaces for every German city over 10,000 inhabitants.

    Check the map
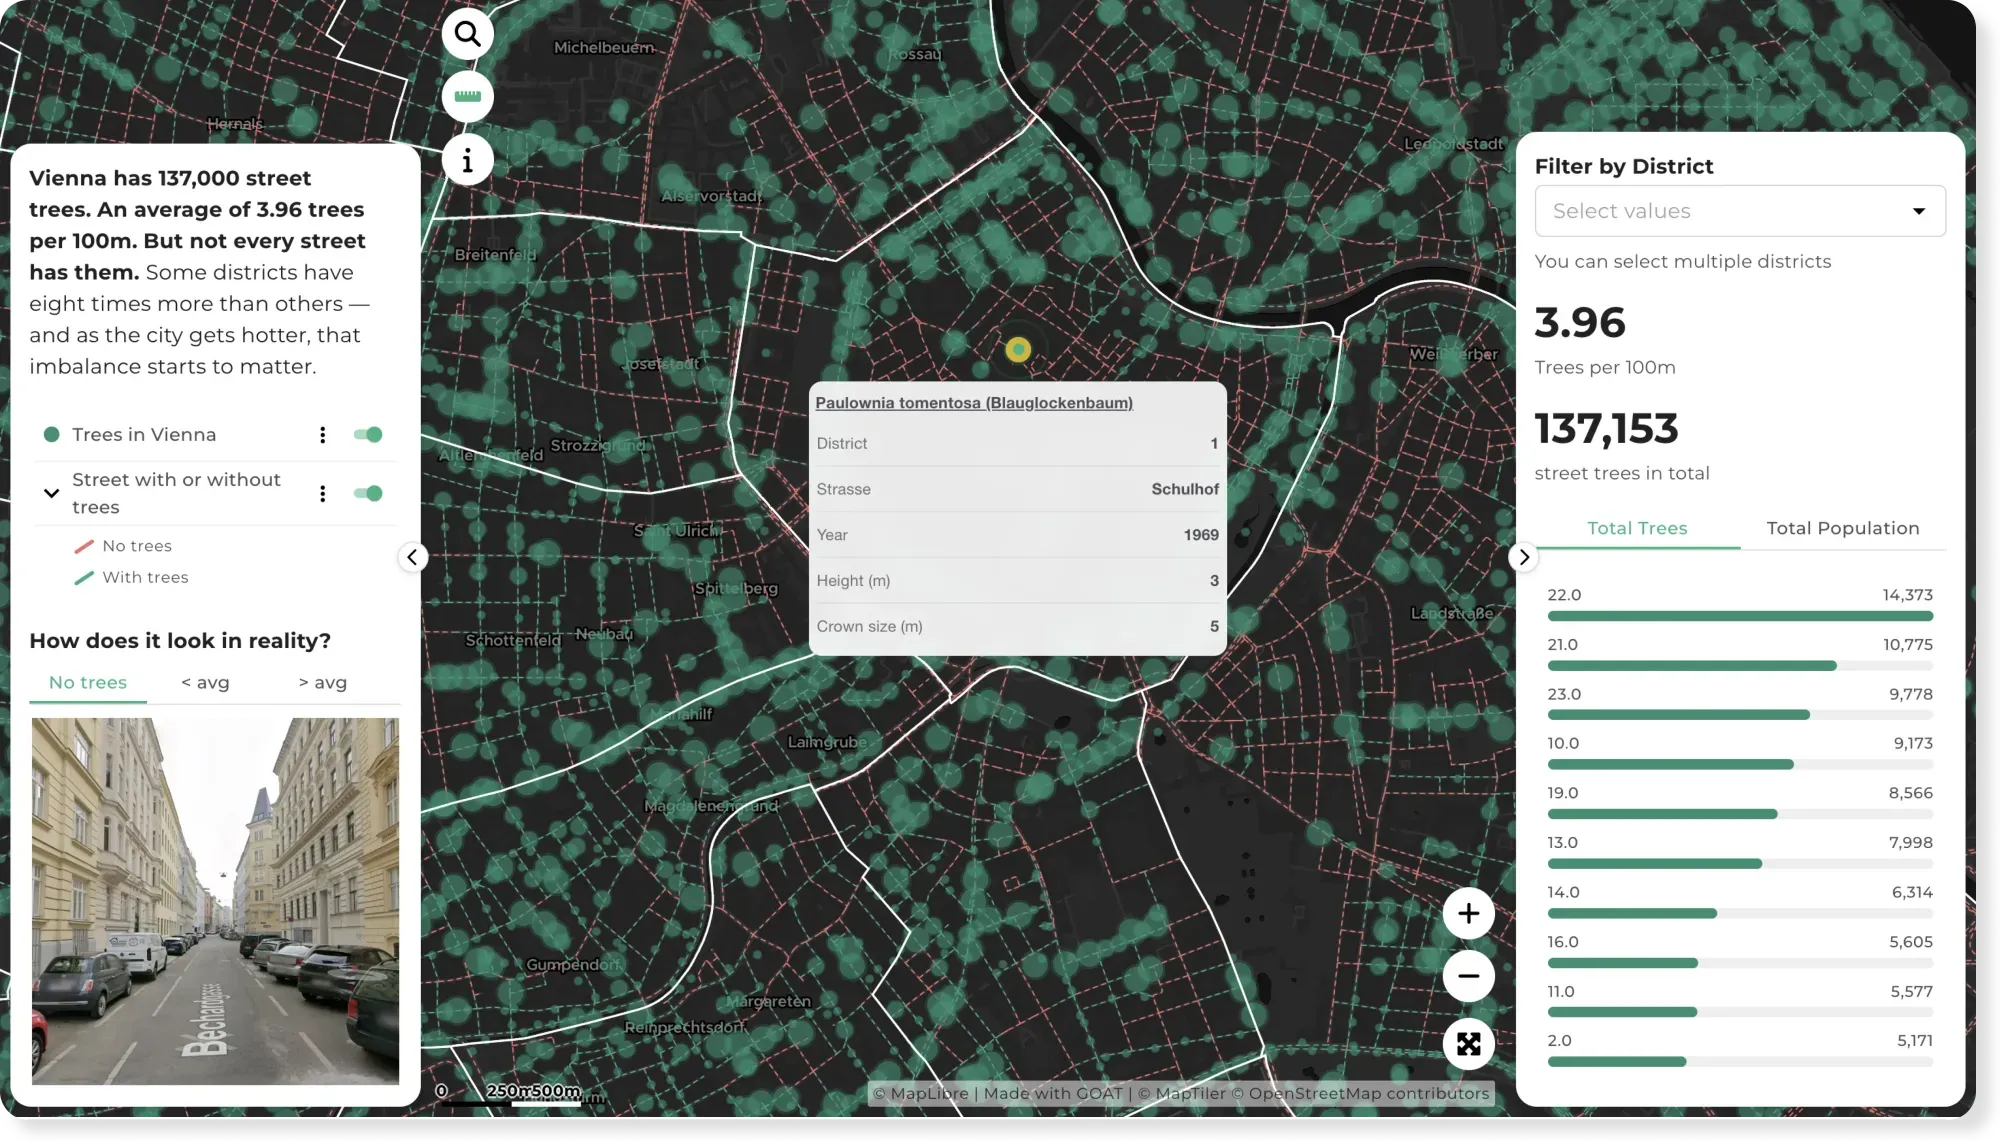
  • Vienna's 137,000 Street Trees — and Where the Shade Runs Out

    Vienna's 137,000 Street Trees — and Where the Shade Runs Out

    Vienna has around 137,000 street trees — but some districts have eight times more than others. This map shows where the street canopy gives shade, and where it doesn't.

    Check the map
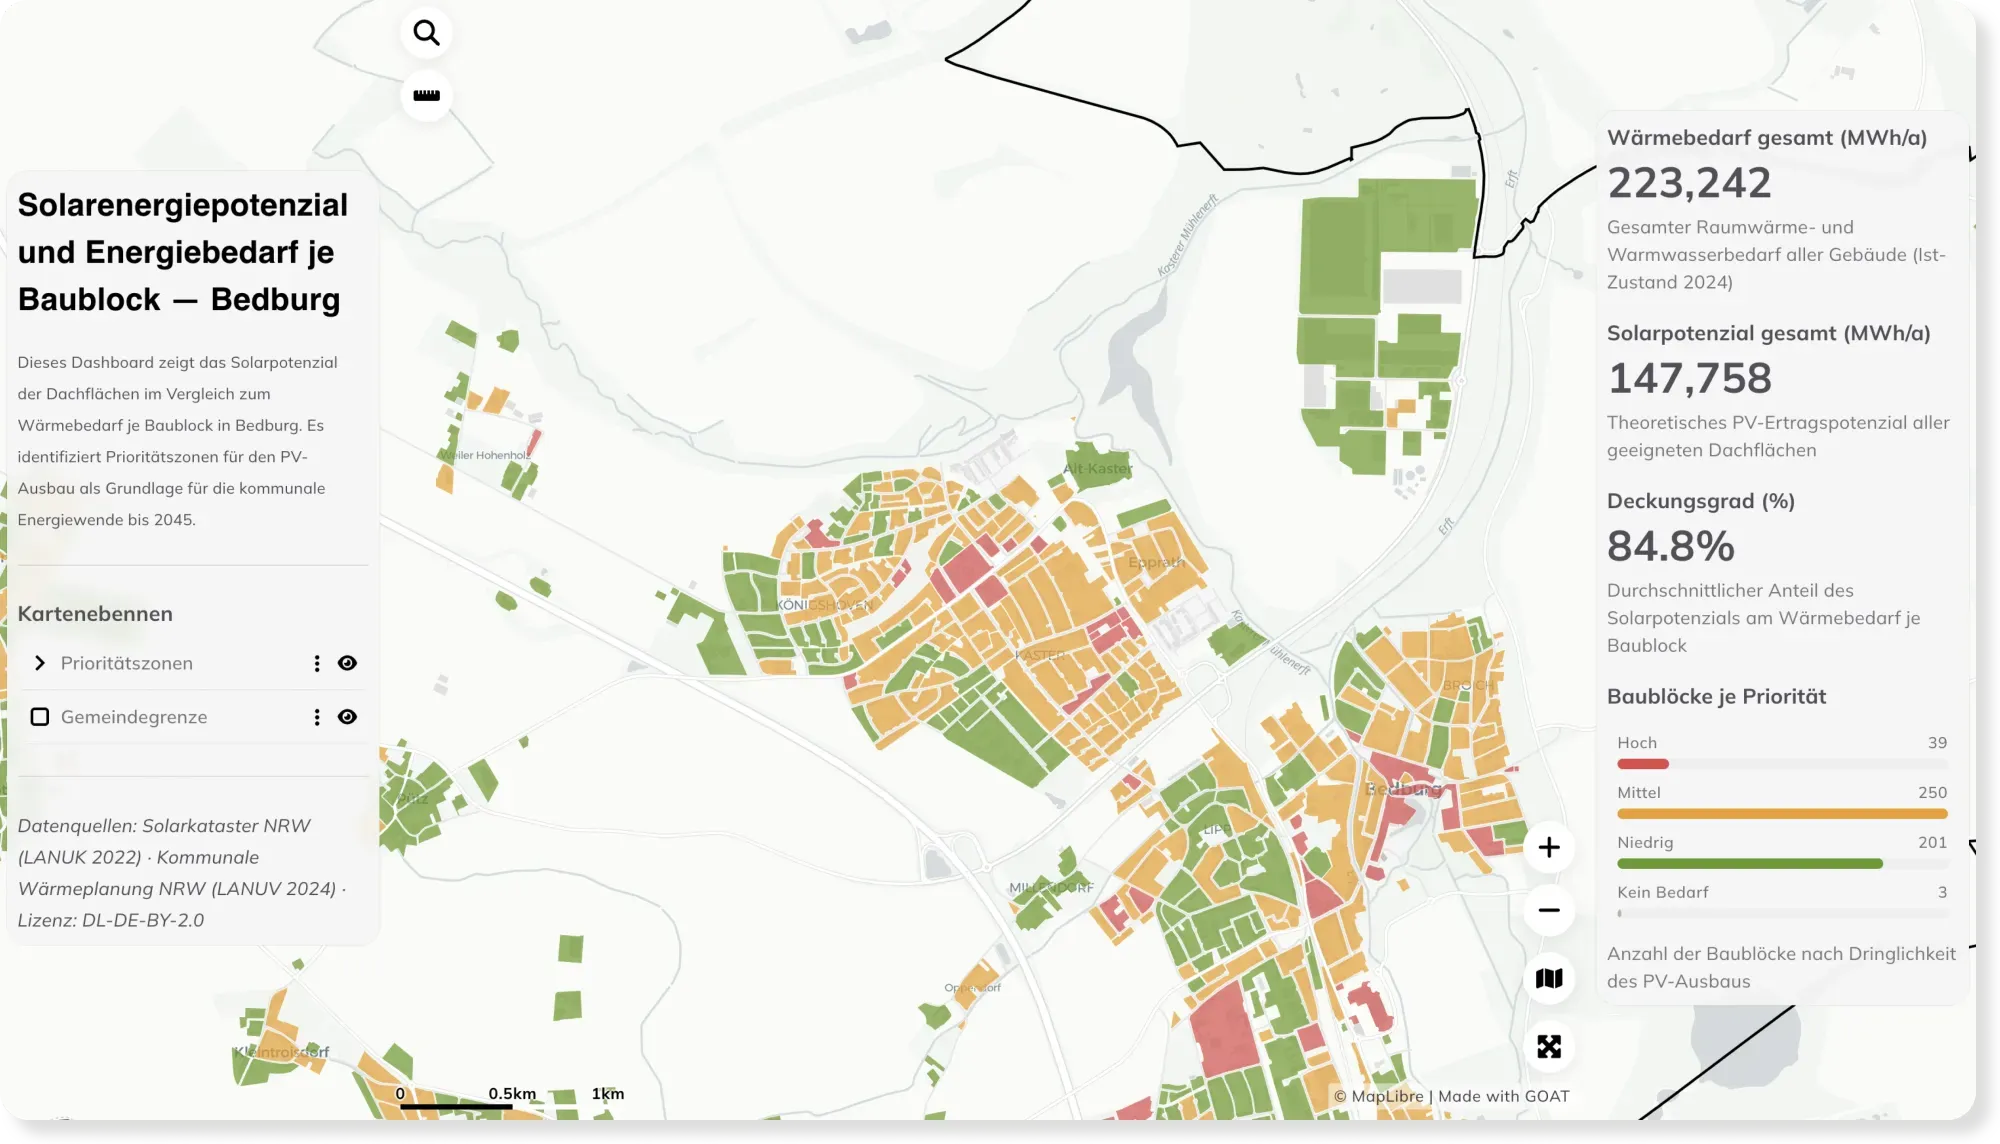
  • Rooftop Solar Potential vs. Energy Demand per Block — Bedburg

    Rooftop Solar Potential vs. Energy Demand per Block — Bedburg

    How much energy could a city's rooftops cover? This dashboard compares rooftop solar potential with heat demand per block in Bedburg, revealing priority zones for solar expansion.

    Check the map

The difference

Why GOAT?

  • Planning indicators and GIS tools, ready and easy to use

    Green space and service accessibility, 15-minute-city scores and catchment areas for any neighbourhood, ready to run with your parameters. Overlay heat, flood and hazard layers with population to see who is actually exposed. Around them sits a full toolbox of GIS and data analysis tools, so you can join, filter and aggregate your own data without leaving the browser.

    Then save the whole thing as a workflow. When the data updates or a boundary changes, run it again. Same method, new result, no rebuilding.

  • A data catalog with AI-powered search

    Over 20,000 ready-to-use datasets: population, settlement structure, land use, administrative boundaries. Describe what you need and the catalog finds it, so you can start the analysis instead of procuring data first.

  • Ready to use, open by design

    Nothing to install. Built on open-source technologies and open standards, so your data and workflows stay portable.

  • Scalable

    From one neighbourhood's adaptation plan to region-wide prioritisation.

  • Proven in practice

    Used in climate adaptation and green space planning projects across Germany.

See how the BBSR is doing it

Nationally comparable climate-adaptation indicators, built to feed federal monitoring from 2027.

Stadtklimadashboard – Application of Indicators for Urban Climate Adaptation

Stadtklimadashboard – Application of Indicators for Urban Climate Adaptation

The Federal Institute for Research on Building, Urban Affairs, and Spatial Development (BBSR) has commissioned the IÖR, in cooperation with Plan4Better, LUP, and bauchplan, to develop an interactive WebGIS dashboard that provides municipalities, state governments, and federal authorities with data-driven support for planning and evaluating climate adaptation measures.

Read the reference

Working on climate adaptation?

Book a slot and we'll look at exposure and green-space access in your area together.

  • Overlay heat, flood and green-space data with population to see who is actually exposed.
  • Measure access to green and open space by district.
  • Prioritise measures by how many people they reach.
  • Reports that evidence your climate and mobility targets.

Ready to make sense of your data?

Join planners, organizations and cities using GOAT to make better decisions, faster. No GIS expertise needed.