Plan4Better

Industries

Energy

The energy transition requires precise spatial planning: where is demand highest, which districts suit integrated energy concepts, and where should infrastructure investments go? GOAT supports energy planners, municipal utilities, and public authorities in turning complex spatial data into clear, decision-ready planning insights.

GOAT dashboards for spatial energy and heat planning
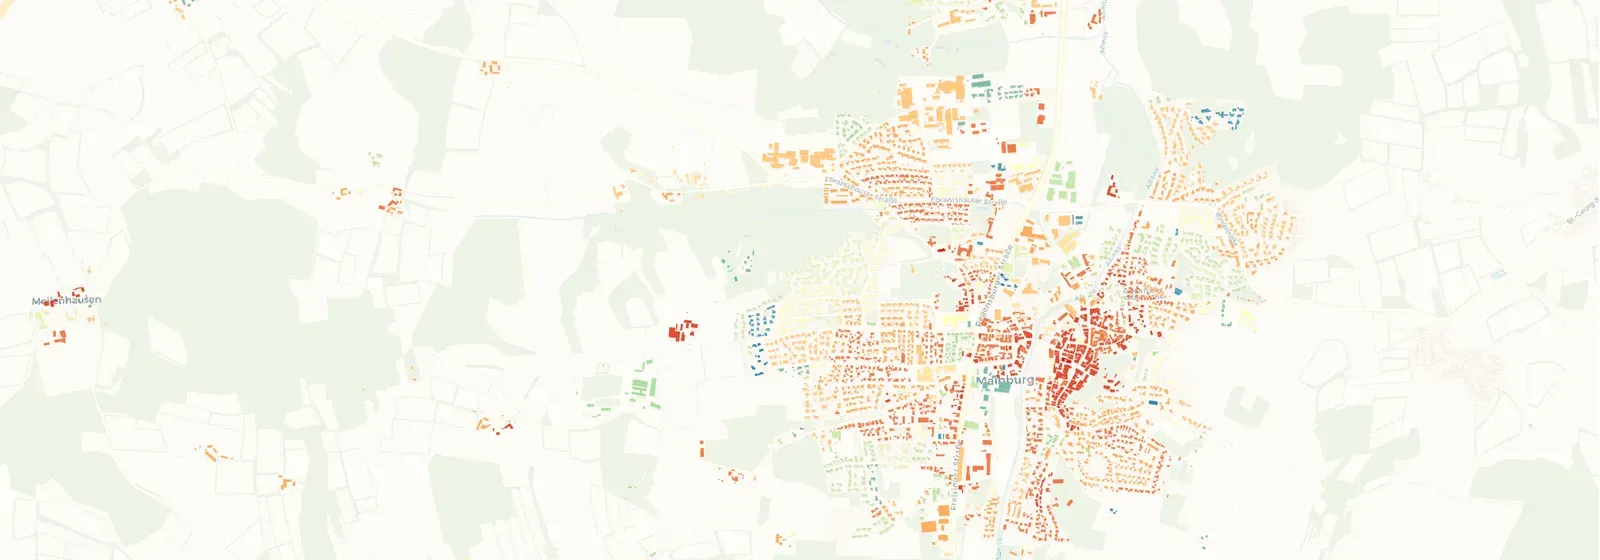
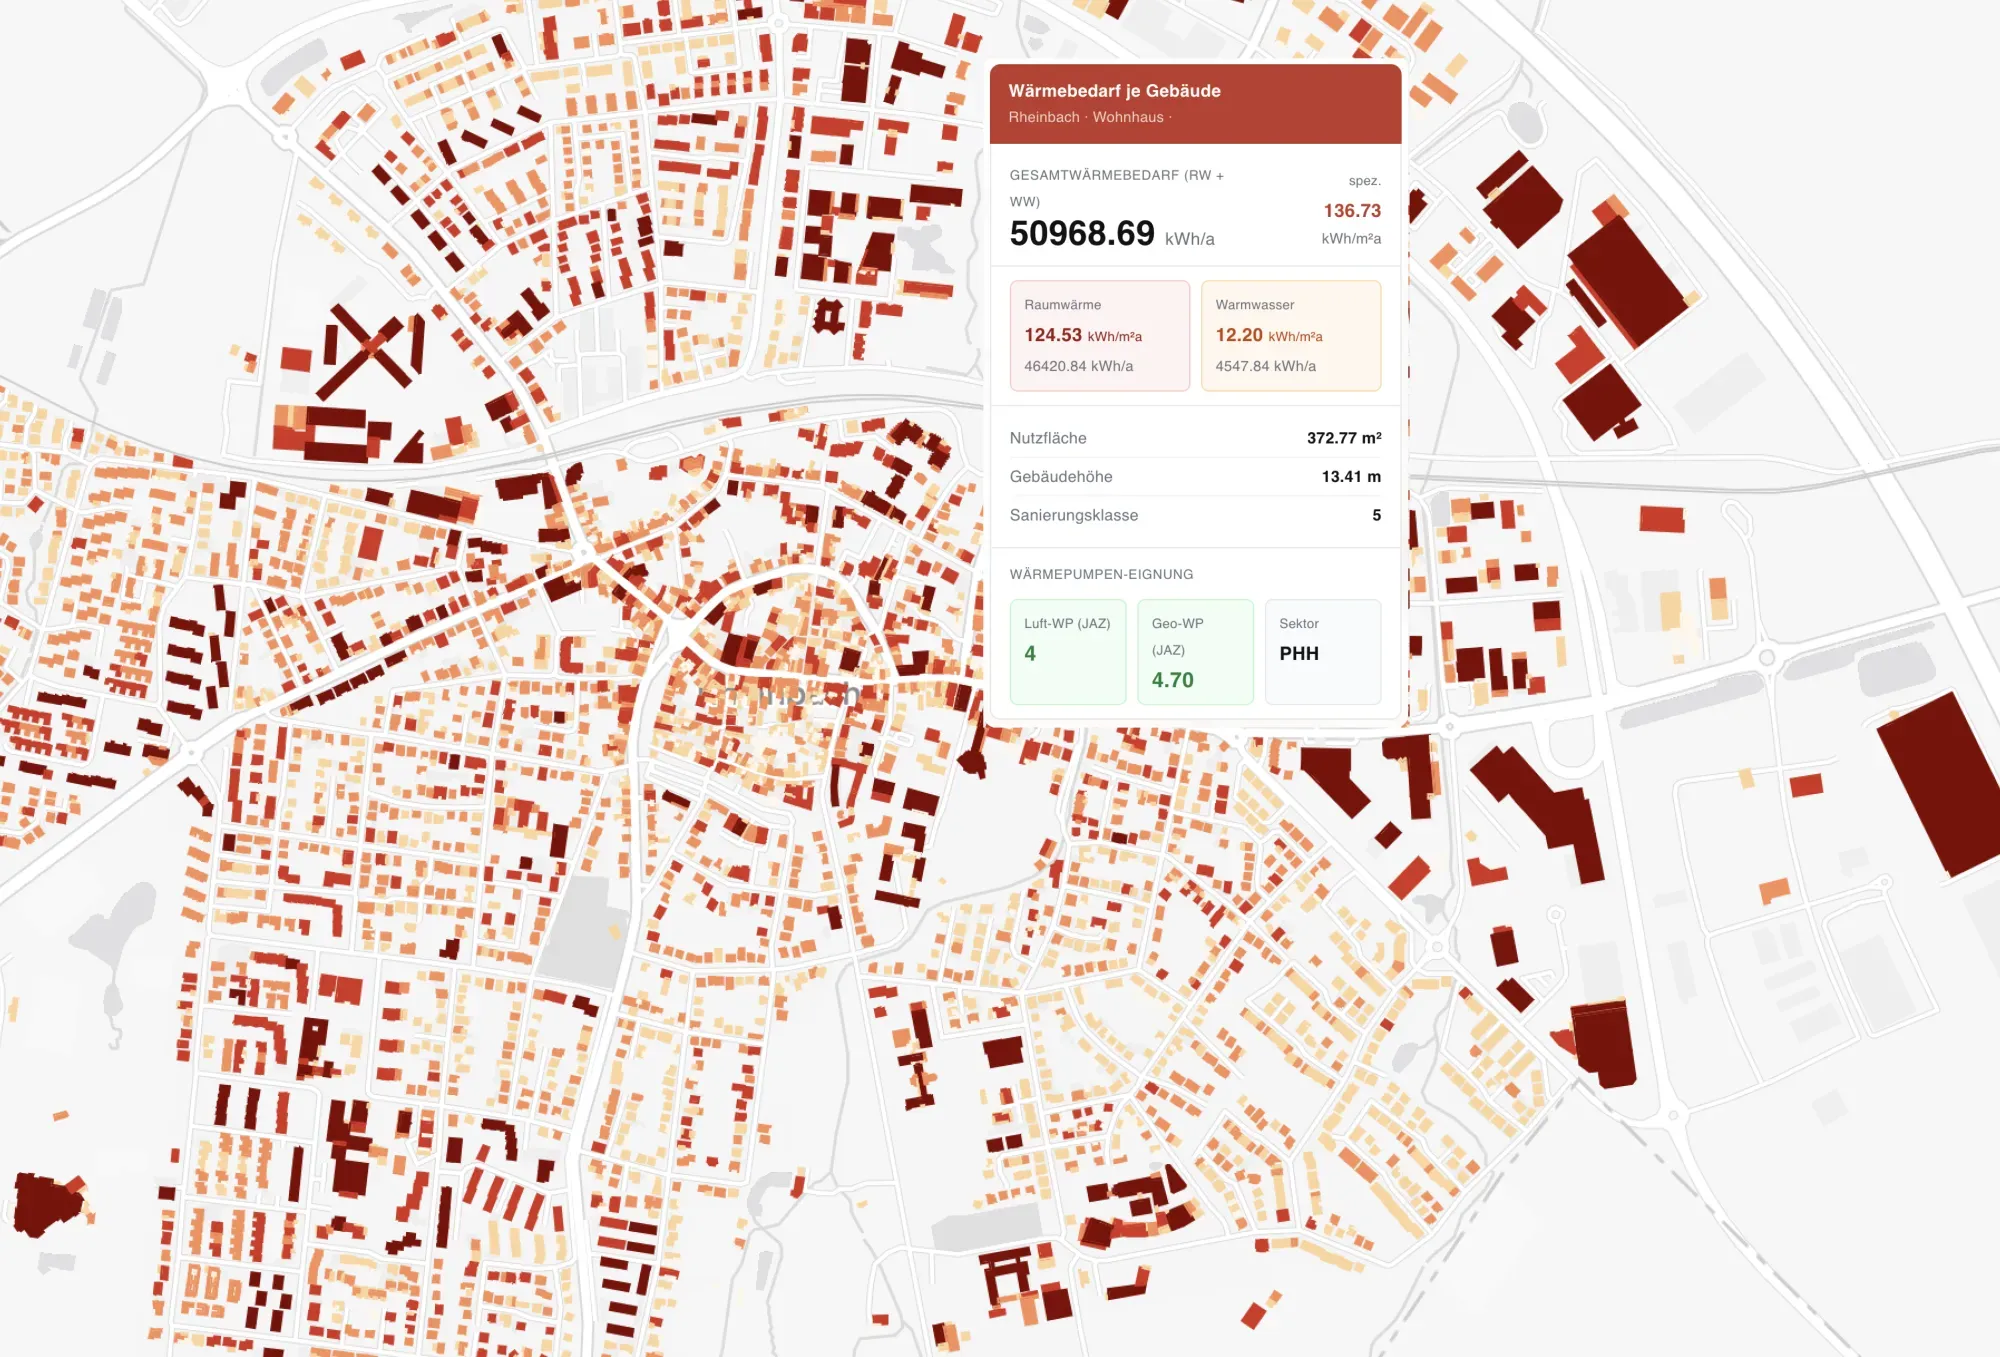
Energy demand and renewable potential mapped across a district in GOAT

Map Energy Demand & Renewable Potential Spatially

Assess the spatial distribution of energy consumption and renewable energy potential across a municipality or district. GOAT enables the integration and visualisation of heat density maps, building stock data, and energy infrastructure into a unified planning environment — supporting scenario development and the definition of target pathways for greenhouse gas-neutral energy supply.
EV charging and mobility infrastructure coverage analysis in GOAT

Plan EV Charging & Mobility Infrastructure Coverage

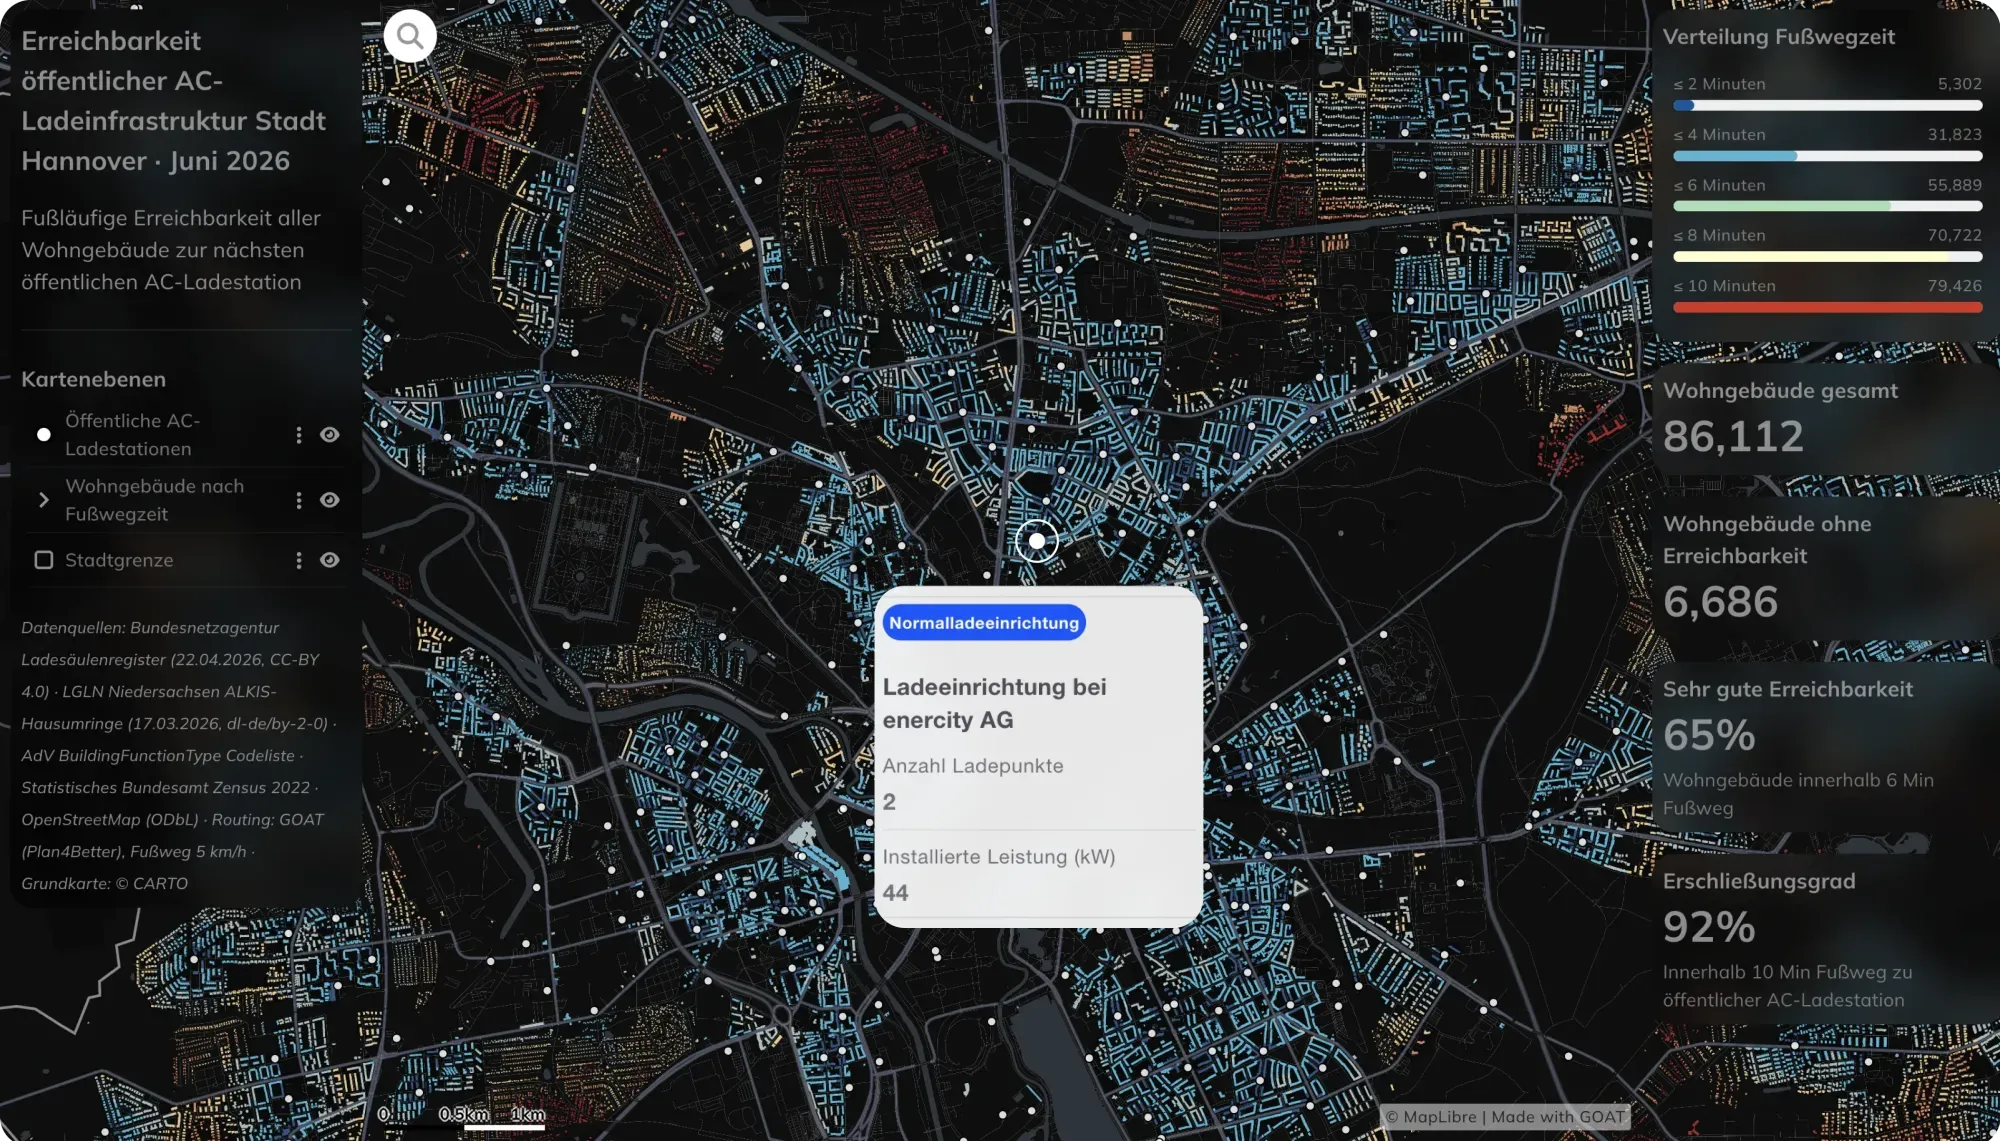
Evaluate the spatial coverage and accessibility of EV charging stations, hydrogen refuelling points, and sustainable mobility infrastructure — identifying underserved areas and supporting data-driven decisions about where new installations are most needed. GOAT's isochrone and catchment area tools help grid operators, municipalities, and mobility planners comply with growing regulatory requirements (EU Alternative Fuels Infrastructure Regulation, German Ladeinfrastrukturgesetz) and optimise network rollout strategies.

Integrated energy and urban district concept analysis in GOAT

Develop Integrated Energy & Urban District Concepts

Develop comprehensive energy and urban development strategies at the district level — combining energy demand analysis with assessments of settlement structure, land use, green space, and mobility. GOAT supports integrated quarter concepts that address energy efficiency, microclimate, and urban quality of life in a single spatial planning framework — as demonstrated in Plan4Better's district concept project for the municipality of Altrip.

Maps made with GOAT

Real analyses built by planners, researchers, and cities — explore what’s possible before you start your own.

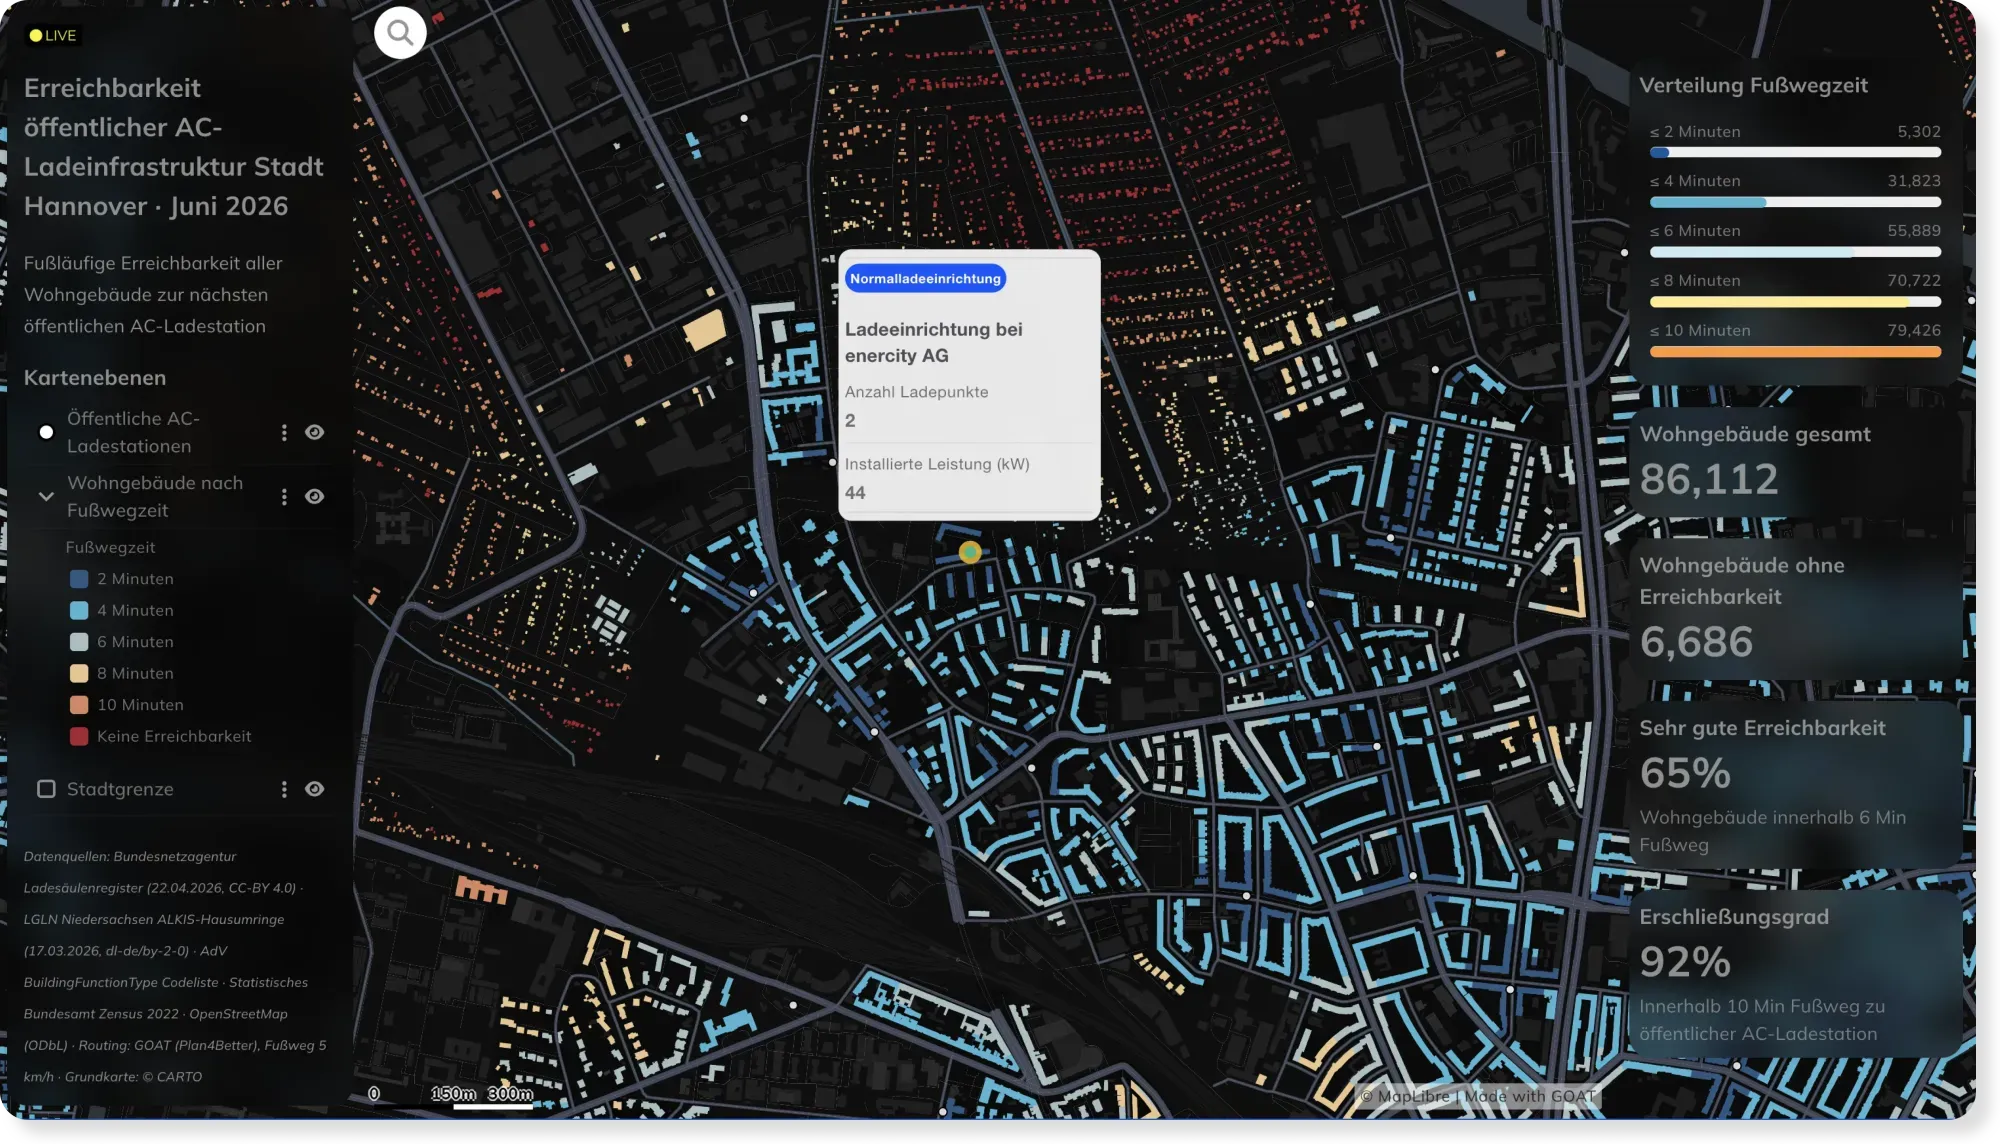
  • Live EV Charging Accessibility in Hannover, Powered by Automated Workflows

    Live EV Charging Accessibility in Hannover, Powered by Automated Workflows

    Charging networks change weekly. This Hannover dashboard stays current automatically — custom SQL and scheduled workflows recompute walking access to every AC charger as the data updates.

    Check the map
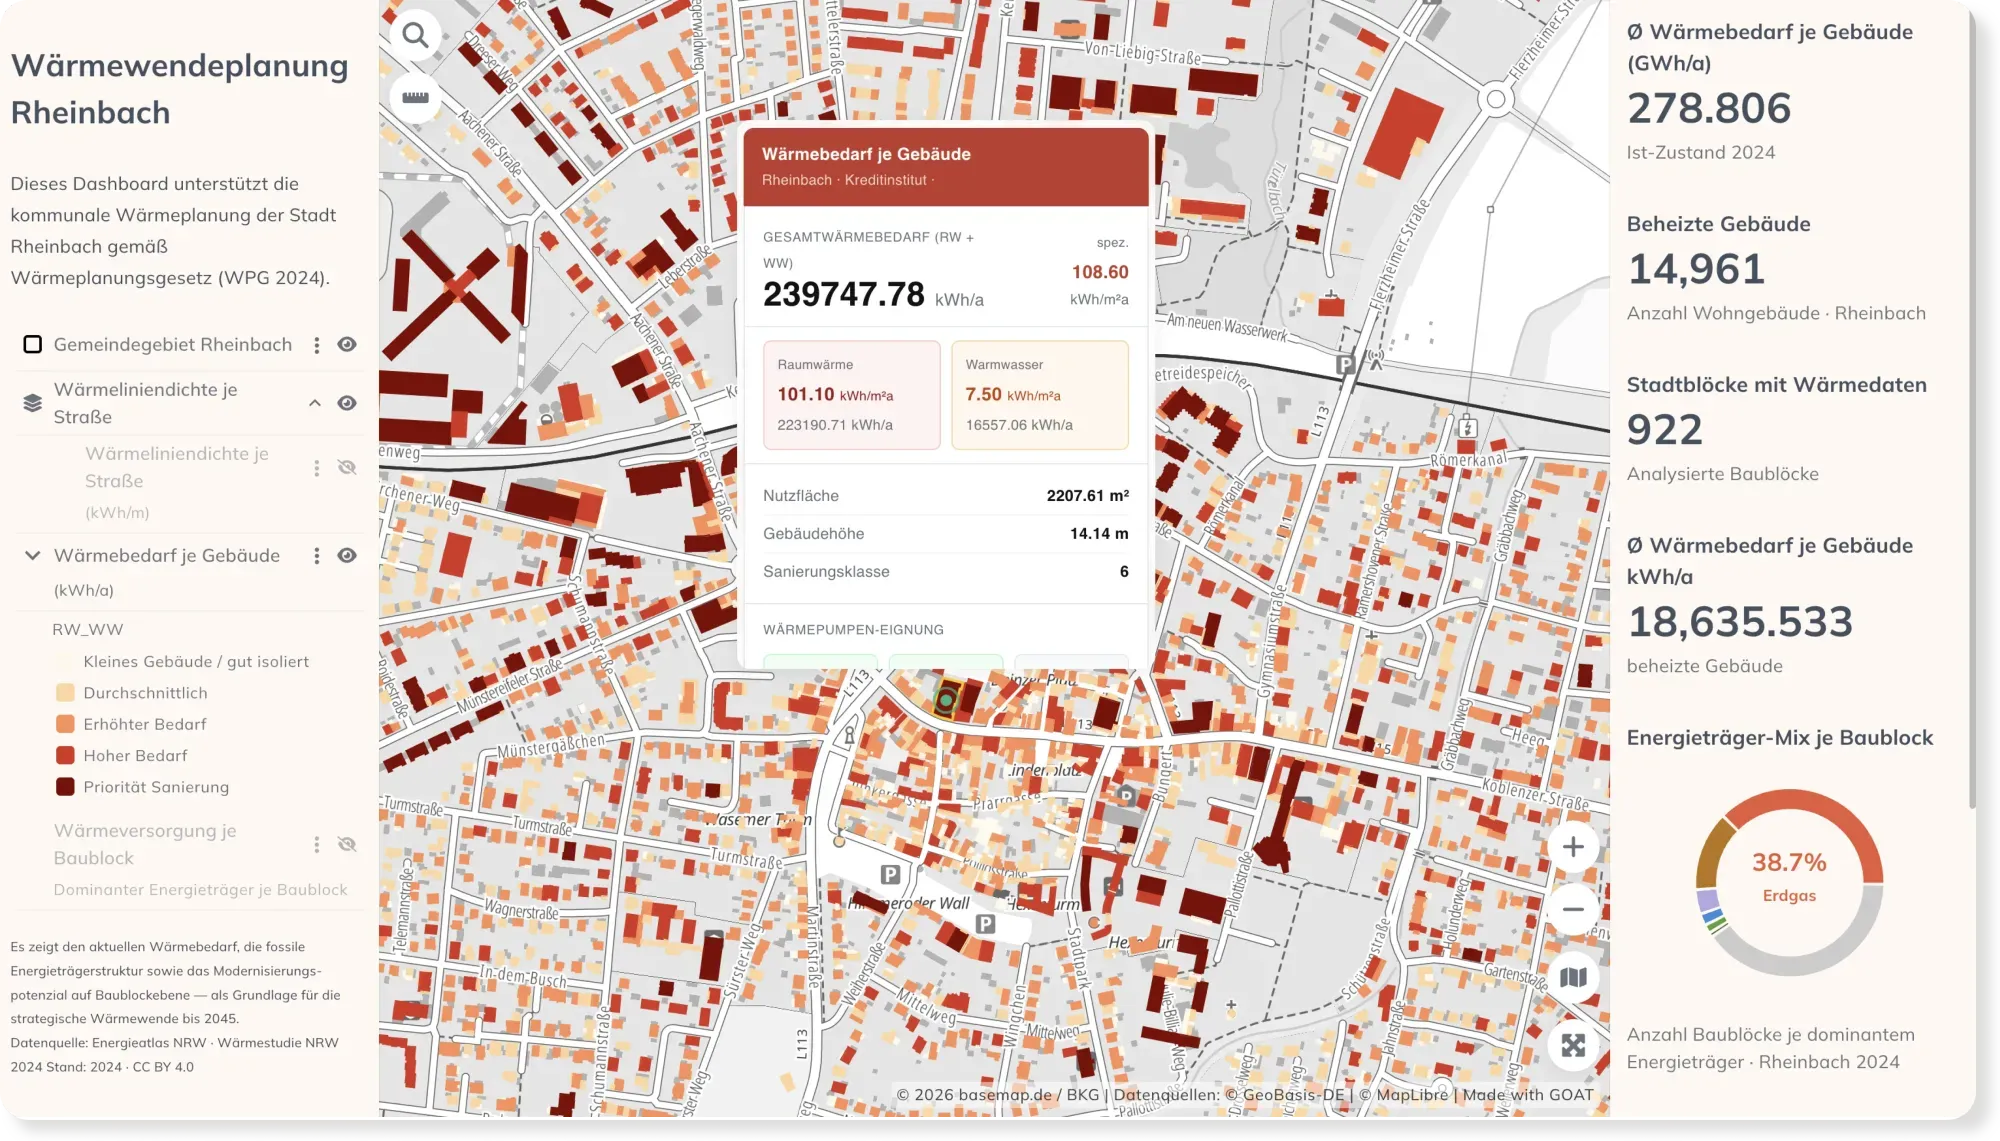
  • Municipal Heat Planning: Heat Demand & Retrofit Priorities in Rheinbach

    Municipal Heat Planning: Heat Demand & Retrofit Priorities in Rheinbach

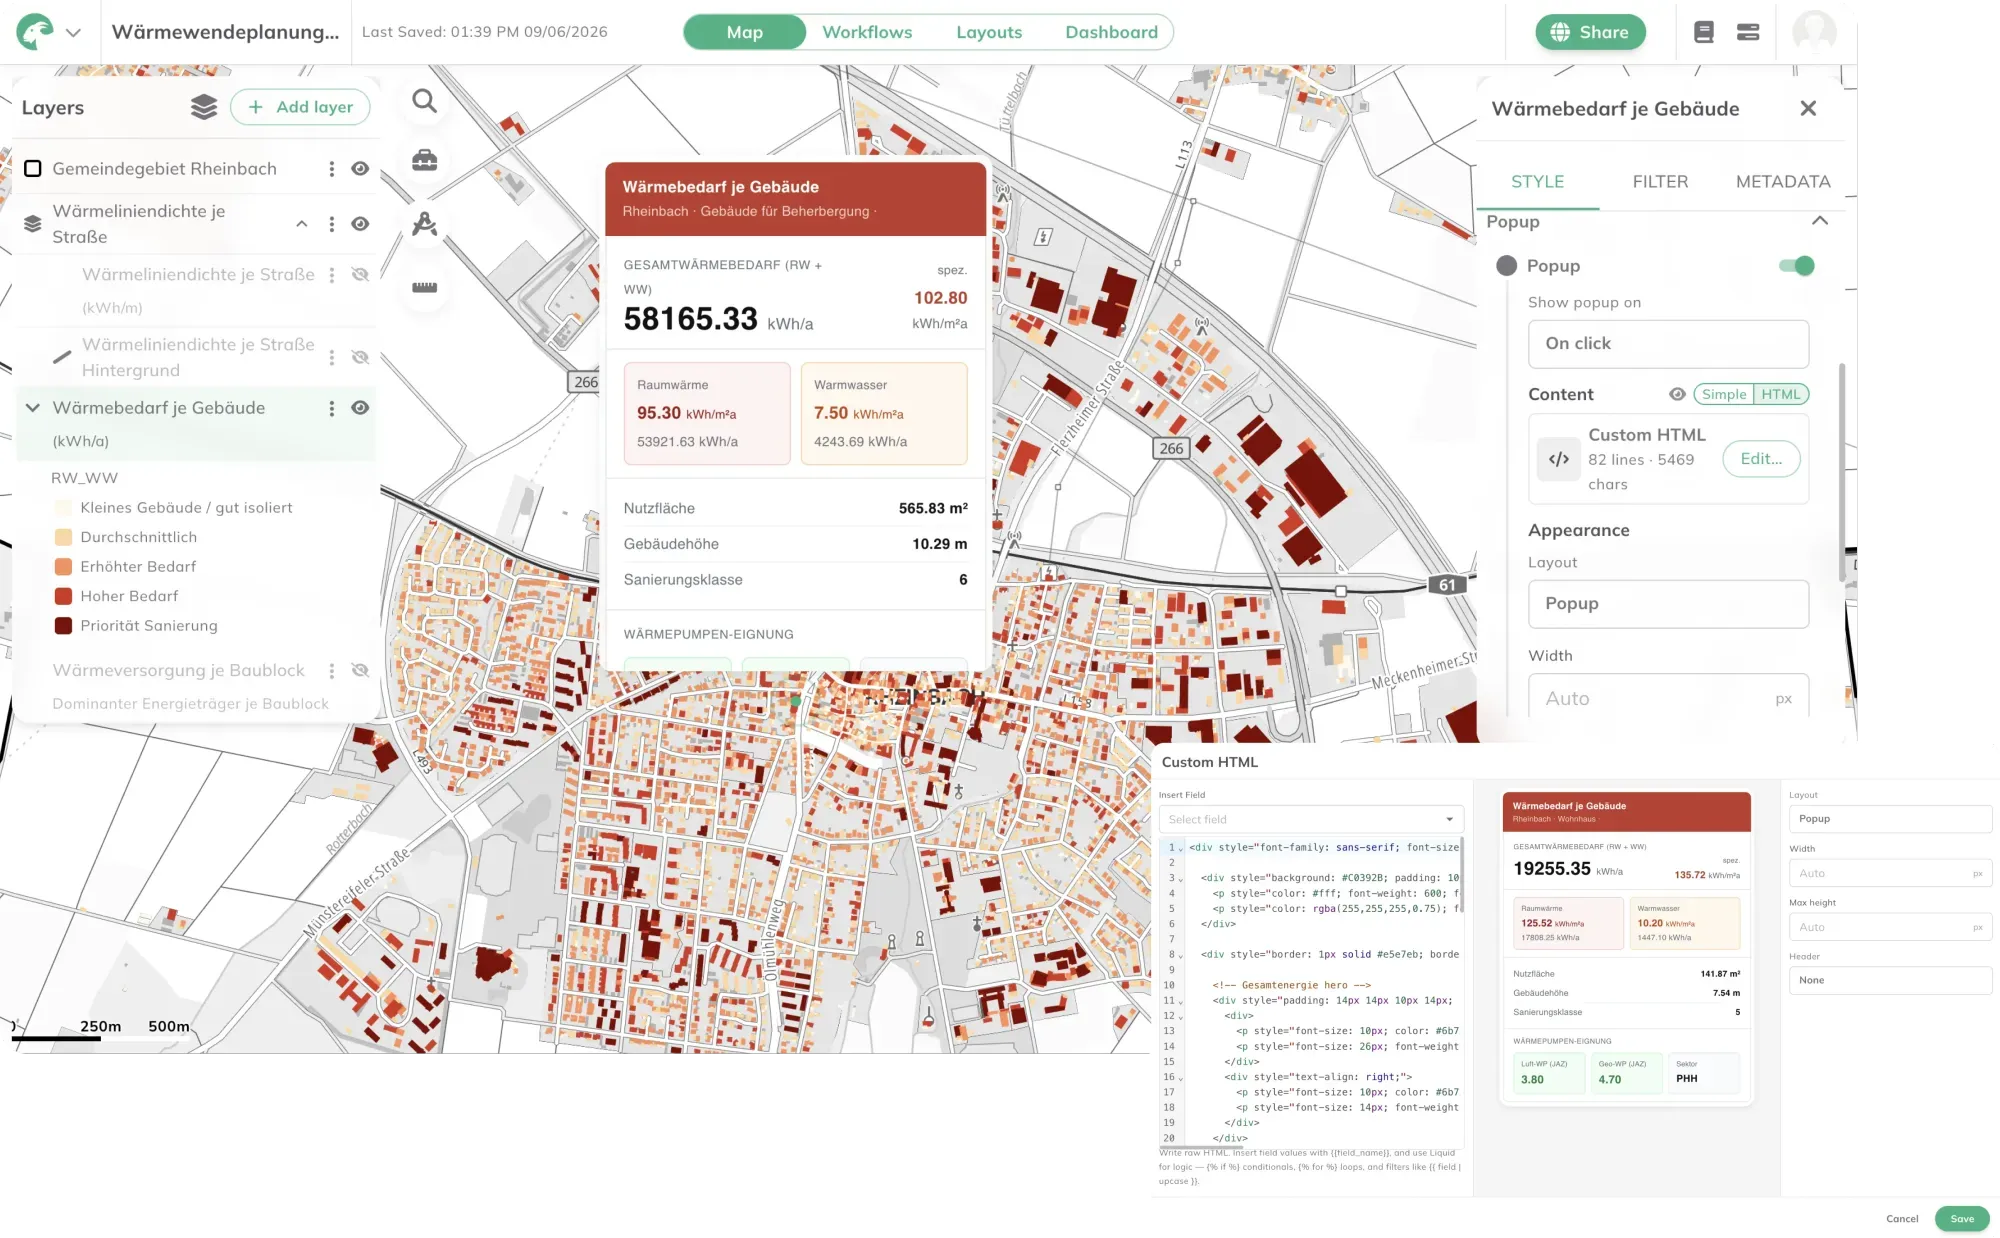
    Germany's Heat Planning Act gives every municipality a deadline to plan its heat transition. This dashboard maps building-level heat demand, the energy mix, and retrofit priorities for Rheinbach.

    Check the map
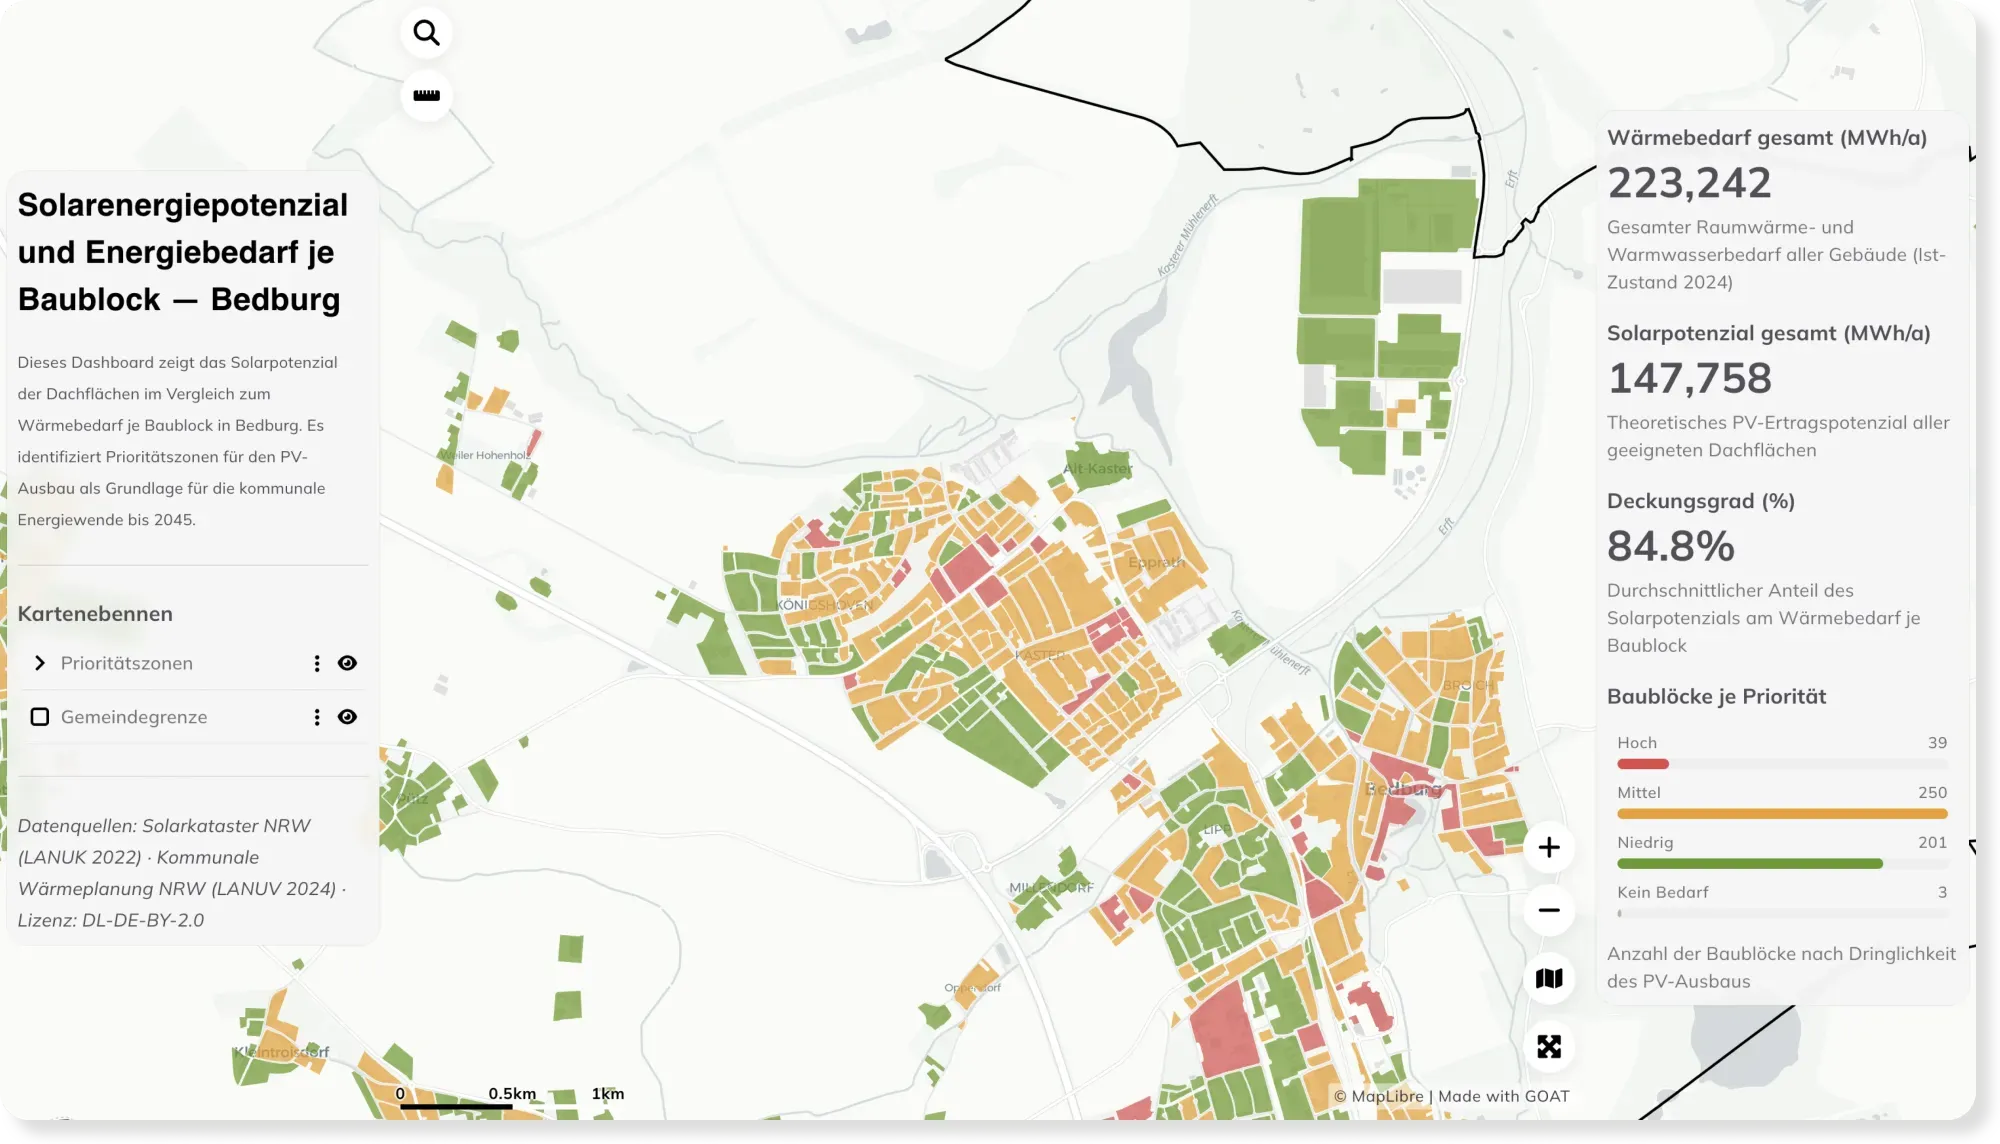
  • Rooftop Solar Potential vs. Energy Demand per Block — Bedburg

    Rooftop Solar Potential vs. Energy Demand per Block — Bedburg

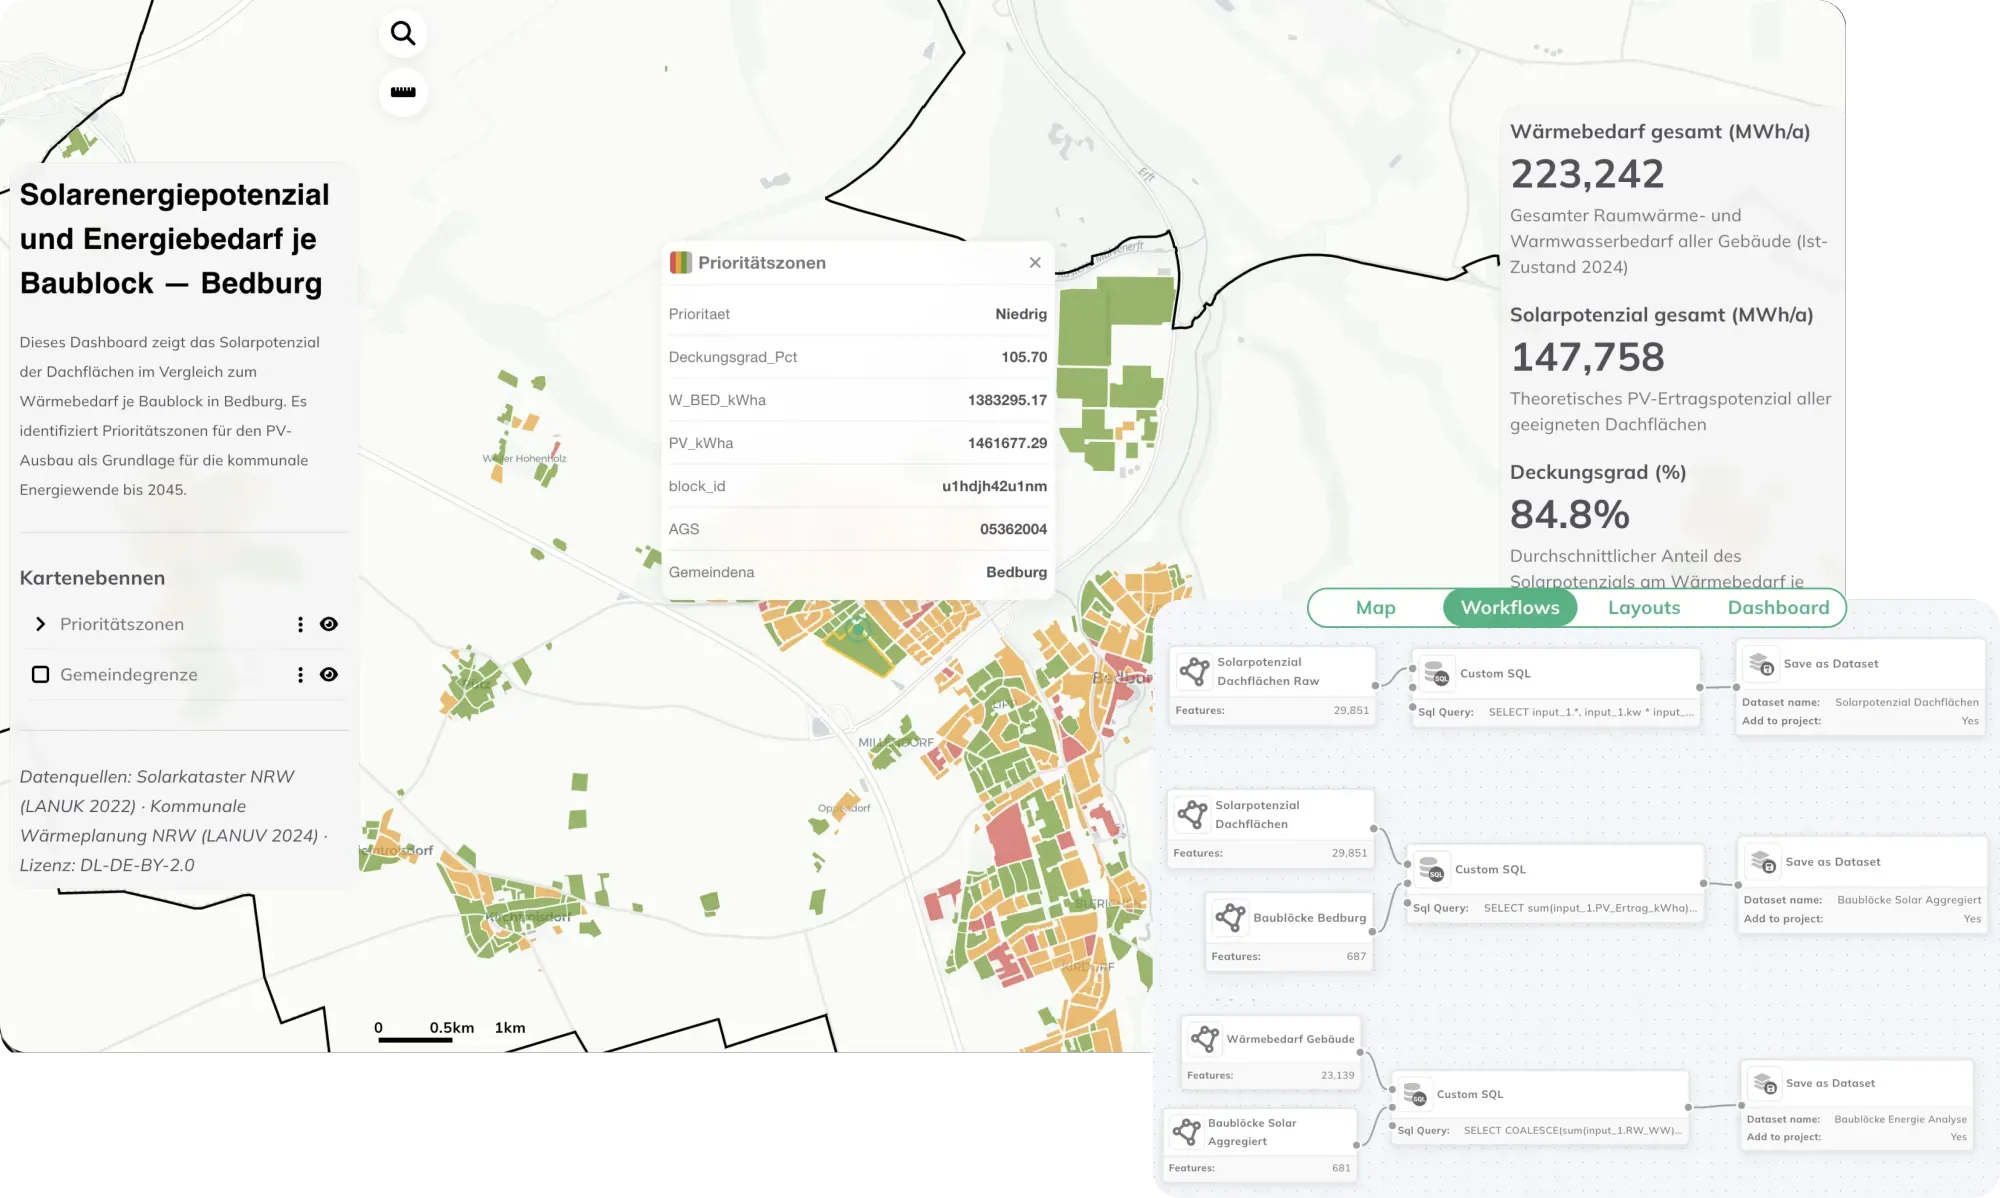
    How much energy could a city's rooftops cover? This dashboard compares rooftop solar potential with heat demand per block in Bedburg, revealing priority zones for solar expansion.

    Check the map

The difference

Why GOAT?

  • Planning indicators and GIS tools, ready and easy to use

    Catchment and demand analysis for charging points, heat networks and renewables, ready to run with your parameters. See where demand sits, which buildings and settlements are in reach, and how siting options compare. Around them sits a full toolbox of GIS and data analysis tools, so you can join, filter and aggregate your own data without leaving the browser.

    Then save the whole thing as a workflow. When the data updates or a boundary changes, run it again. Same method, new result, no rebuilding.

  • A data catalog with AI-powered search

    Over 20,000 ready-to-use datasets: buildings, settlement structure, street networks, population. Describe what you need and the catalog finds it, so you can start the analysis instead of procuring data first.

  • Ready to use, open by design

    Nothing to install. Built on open-source technologies and open standards, so your data and workflows stay portable.

  • Scalable

    From a single charging site to municipal heat planning across a district.

  • Proven in practice

    Used for charging infrastructure and heat planning projects in Germany.

See how Mainburg is doing it

A municipal heat plan from status analysis through to the WebGIS the town keeps using.

Municipal Heating Plan for the City of Mainburg

Municipal Heating Plan for the City of Mainburg

Plan4Better, in collaboration with a partner, is developing a municipal heating plan for the City of Mainburg to enable greenhouse gas-neutral heat supply by 2045.

Read the reference

Planning energy infrastructure?

Book a slot and we'll look at demand and siting in your area together.

  • Site charging infrastructure against real demand and catchment.
  • Support municipal heat planning with building, network and settlement data.
  • Assess siting options for renewables alongside settlement and accessibility constraints.
  • Map-based reports for council and stakeholder discussions.

Ready to make sense of your data?

Join planners, organizations and cities using GOAT to make better decisions, faster. No GIS expertise needed.