
Back to the Gallery Map Gallery
Live EV Charging Accessibility in Hannover, Powered by Automated Workflows
Charging networks change weekly. This Hannover dashboard stays current automatically — custom SQL and scheduled workflows recompute walking access to every AC charger as the data updates.
Most accessibility maps are a snapshot — accurate the day they’re made, stale a month later. Charging infrastructure changes too fast for that. This dashboard takes a different approach: it measures the walking distance from every residential building in Hannover to the nearest public AC charging station, and keeps that calculation live. Custom SQL queries define the analysis, workflows to re-run whenever the underlying charging data changes, and the map updates itself — no manual rebuild, no exported snapshot going out of date. It shows what GOAT looks like as a data pipeline rather than a one-off study: the analysis is written once, automated, and connected to live data, so the picture of who can reach a charger is always current. The same automated setup transfers to any indicator a city needs to monitor over time.
More maps to explore
- Energy
- Sustainability & Climate Risk
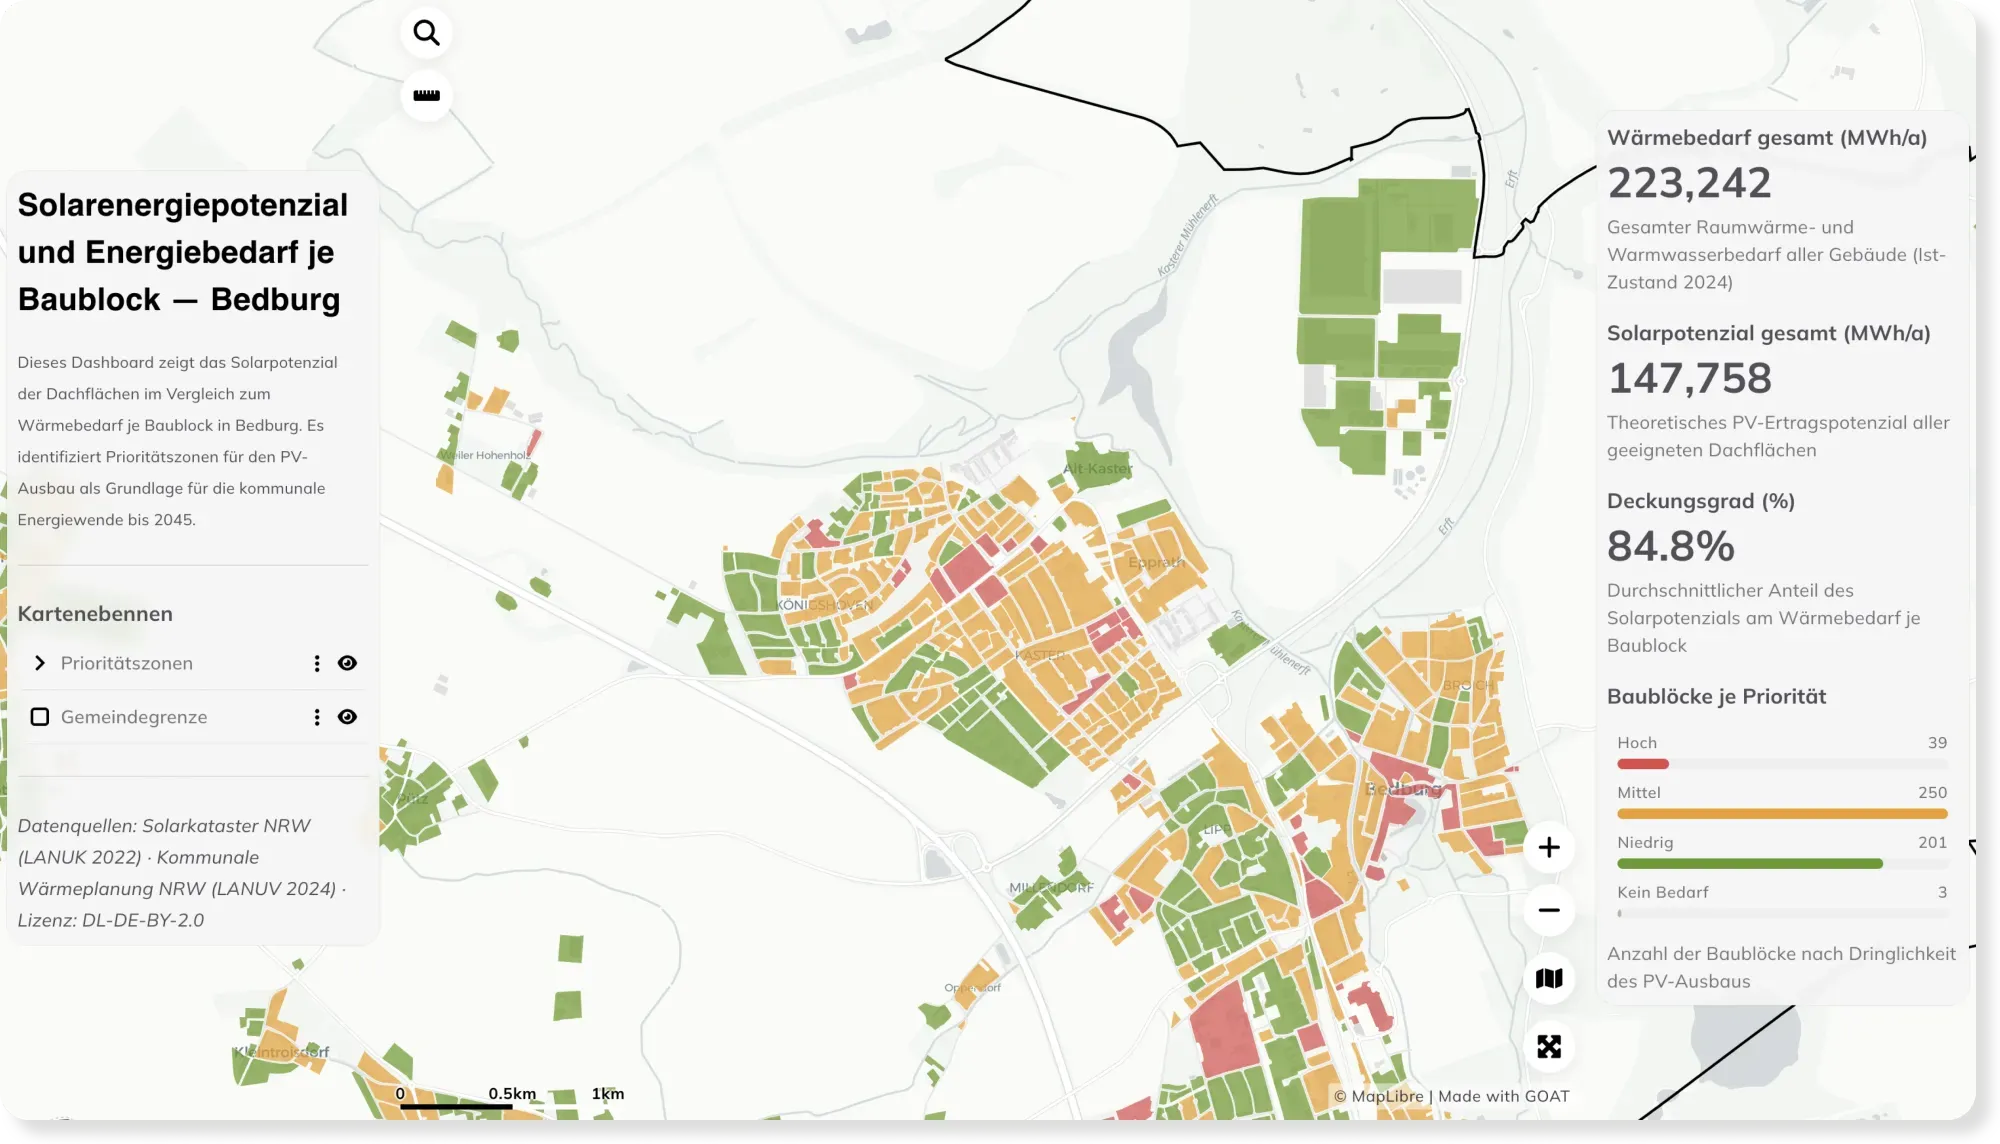
Rooftop Solar Potential vs. Energy Demand per Block — Bedburg
How much energy could a city's rooftops cover? This dashboard compares rooftop solar potential with heat demand per block in Bedburg, revealing priority zones for solar expansion.
See the map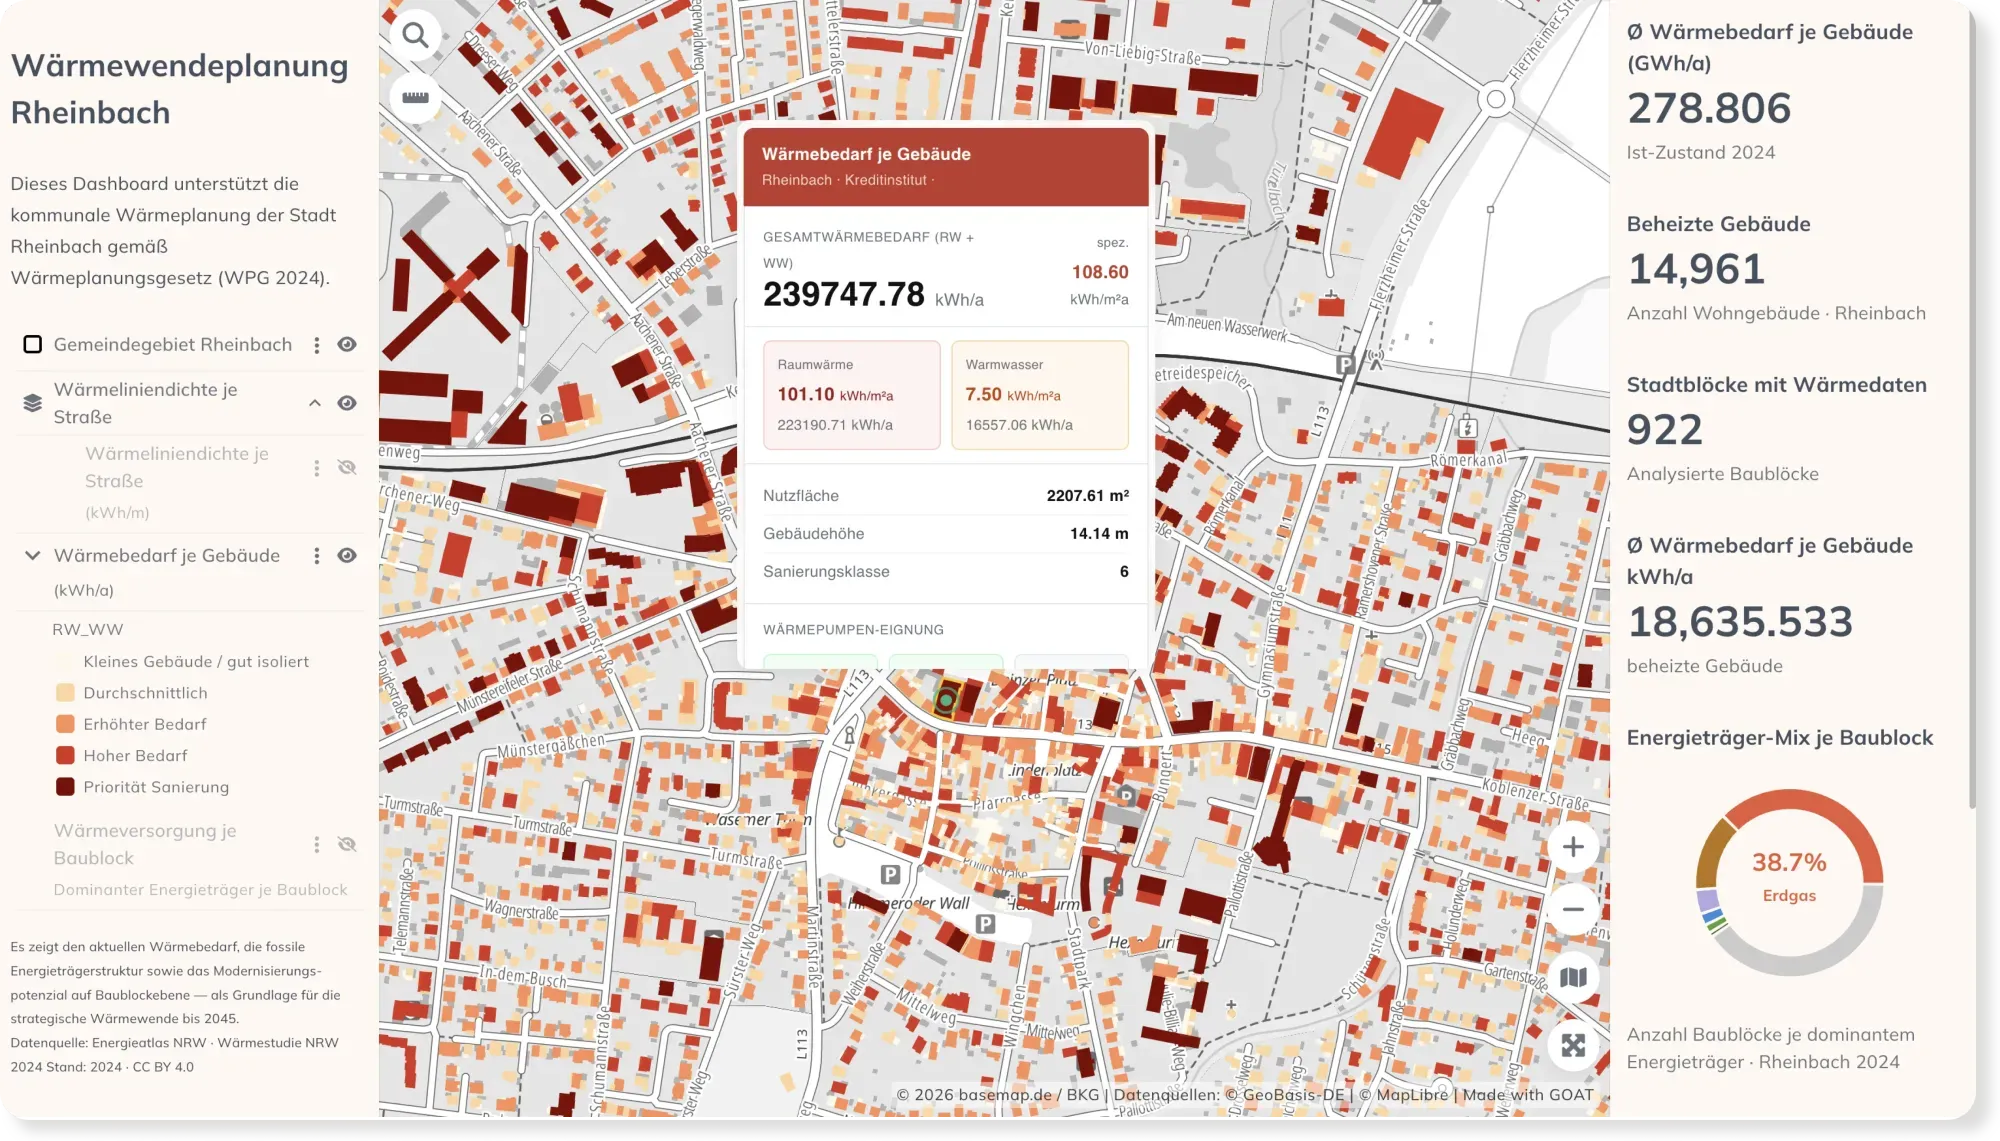
- Energy
- Sustainability & Climate Risk
- Cities & Government
Municipal Heat Planning: Heat Demand & Retrofit Priorities in Rheinbach
Germany's Heat Planning Act gives every municipality a deadline to plan its heat transition. This dashboard maps building-level heat demand, the energy mix, and retrofit priorities for Rheinbach.
See the map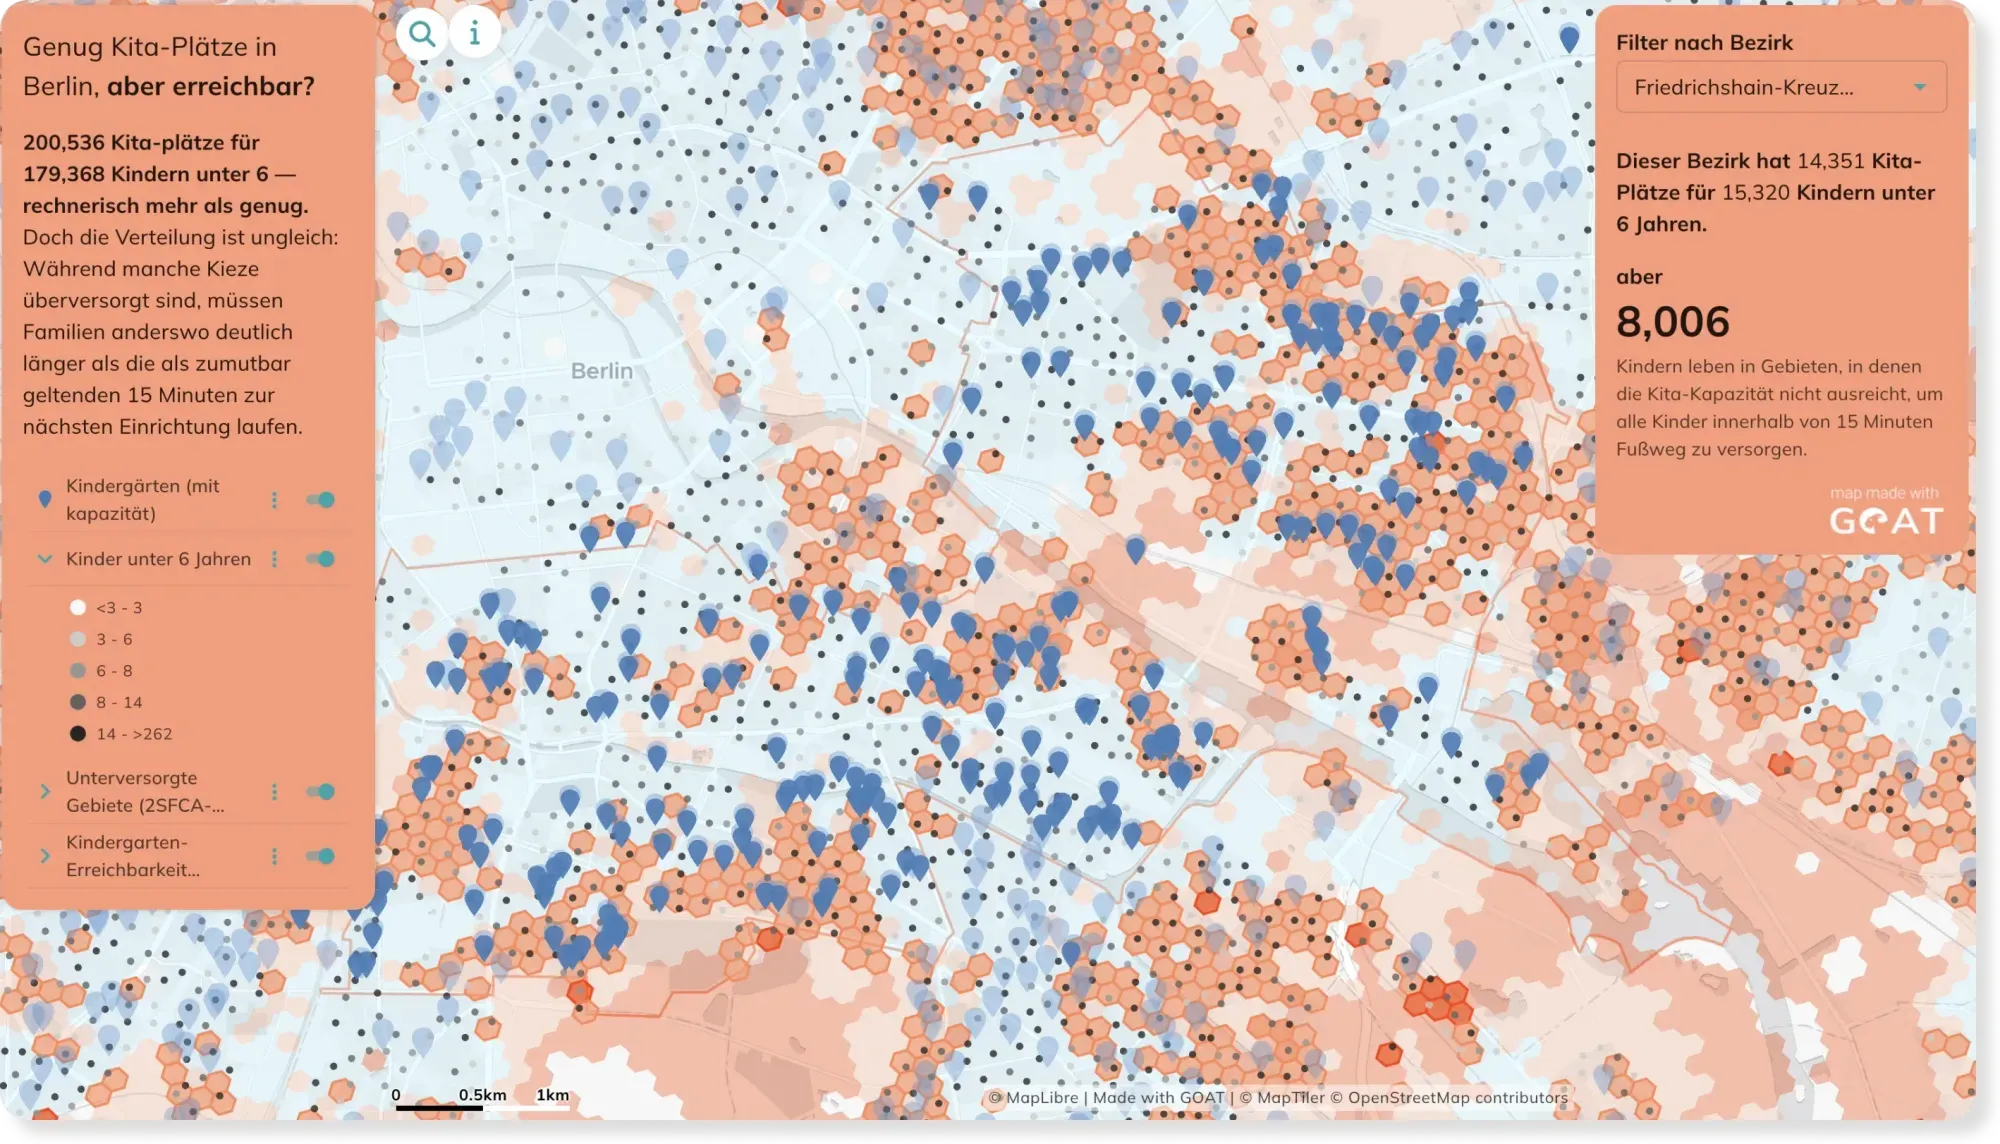
- Mobility Planning
- Cities & Government
Kindergarden accessibility in Berlin: Distance and Capacity combined
A kindergarden five minutes away doesn't help if every place is already taken. This map goes beyond simple distance and factors in capacity too — showing where families are truly cared for.
See the map
Ready to make sense of your data?
Join planners, organizations and cities using GOAT to make better decisions, faster. No GIS expertise needed.