
Back to the Gallery Map Gallery
Property Sales Dashboard
Give buyers more than a brochure. With GOAT, present your development as an interactive map — location, apartments, floor plans, and availability in one place buyers can explore.
Buyers rarely fall in love with a PDF. This is what you can hand them instead: your whole development on one interactive map. They explore the location themselves — everything within a 15-minute walk, from transport and supermarkets to schools and green space — then zoom into the building: apartment sizes and layouts, floor plans, prices by type, and which units are still available. For a developer or sales team, it replaces a stack of brochures with a single link that does the selling — and it’s built in GOAT, with no GIS team required. The same setup works for any development you bring to market.
The development shown is fictional, created to demonstrate GOAT’s capabilities.
More maps to explore
- Real Estate
- Cities & Government
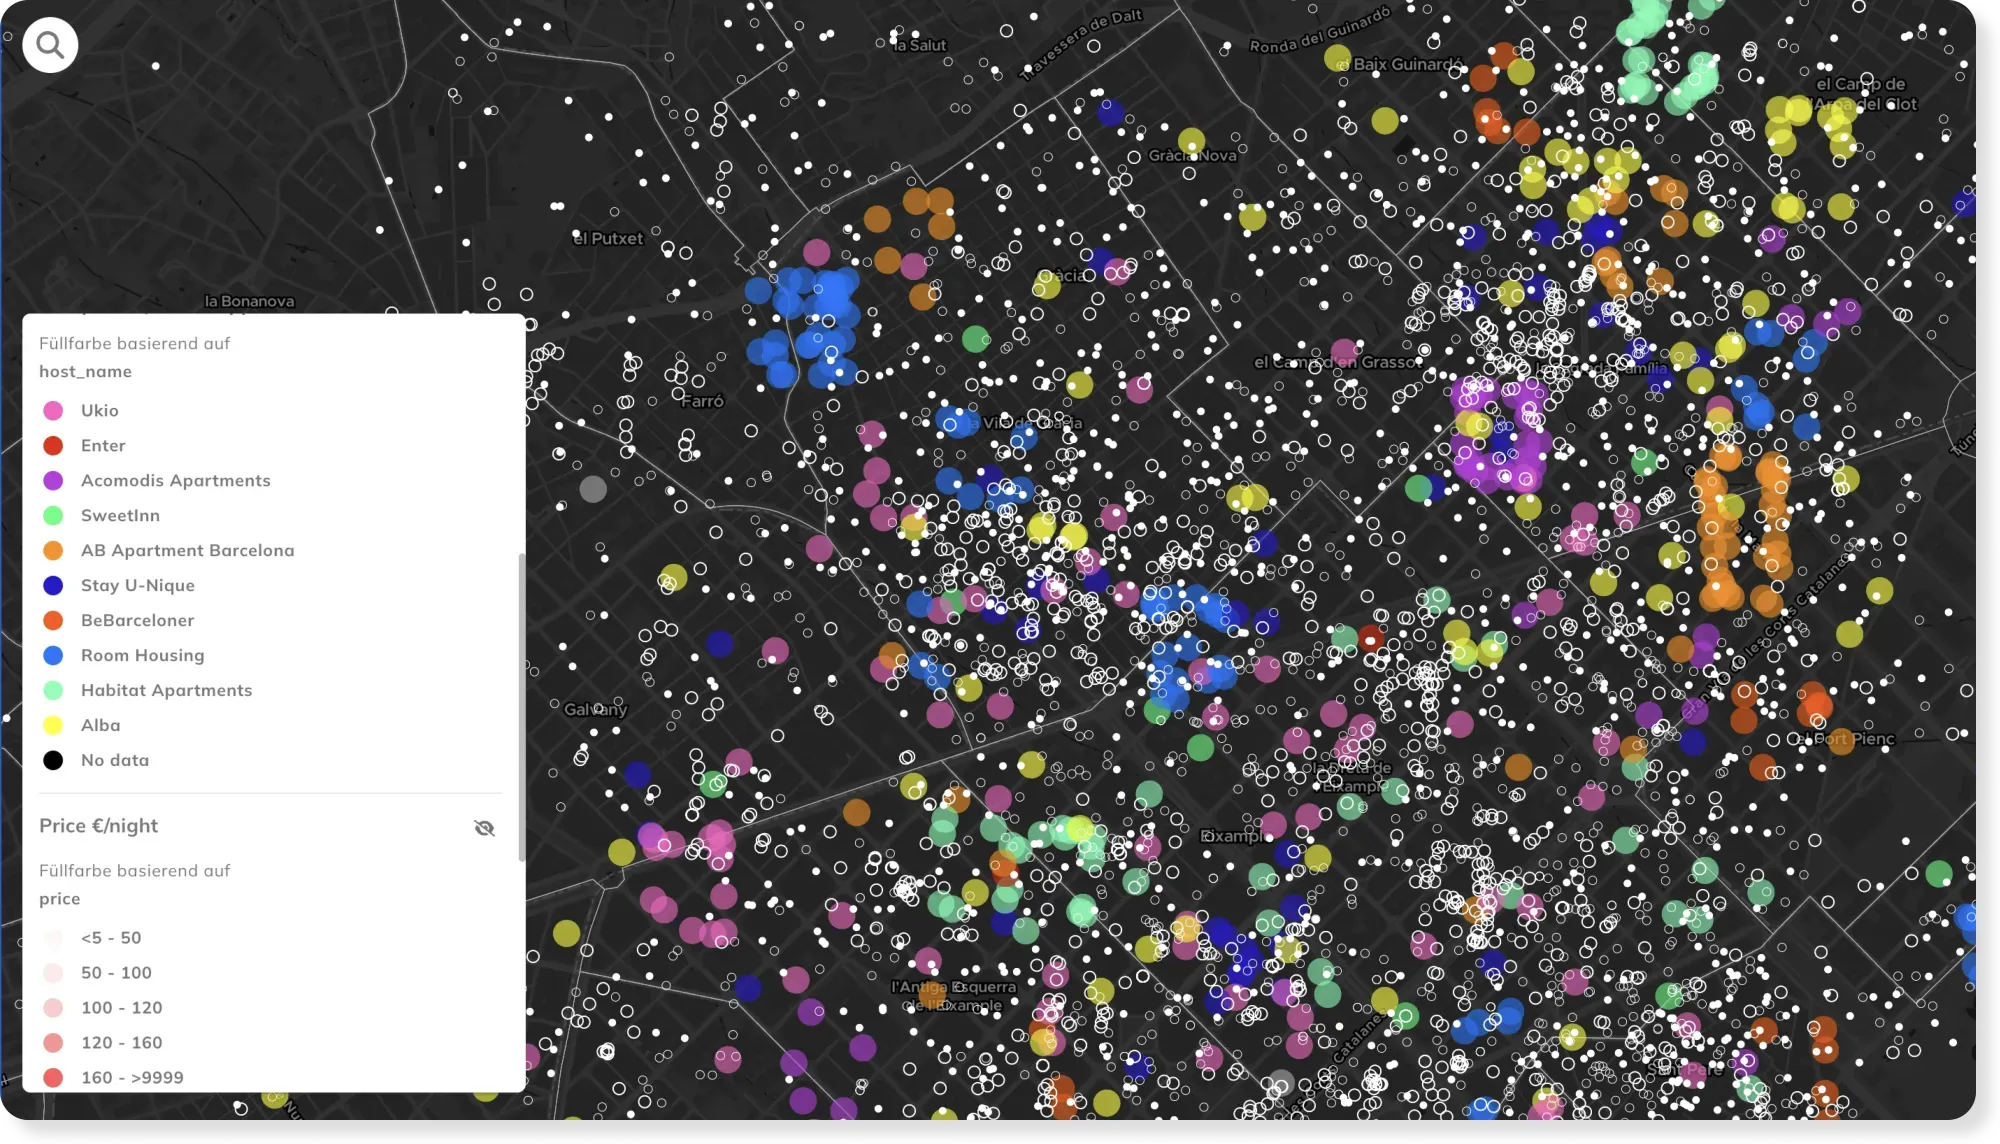
Short-Term Rental Monitoring
The rapid rise of Airbnb has sparked major debates in cities worldwide. This map looks into Barcelona's Airbnb landscape.
See the map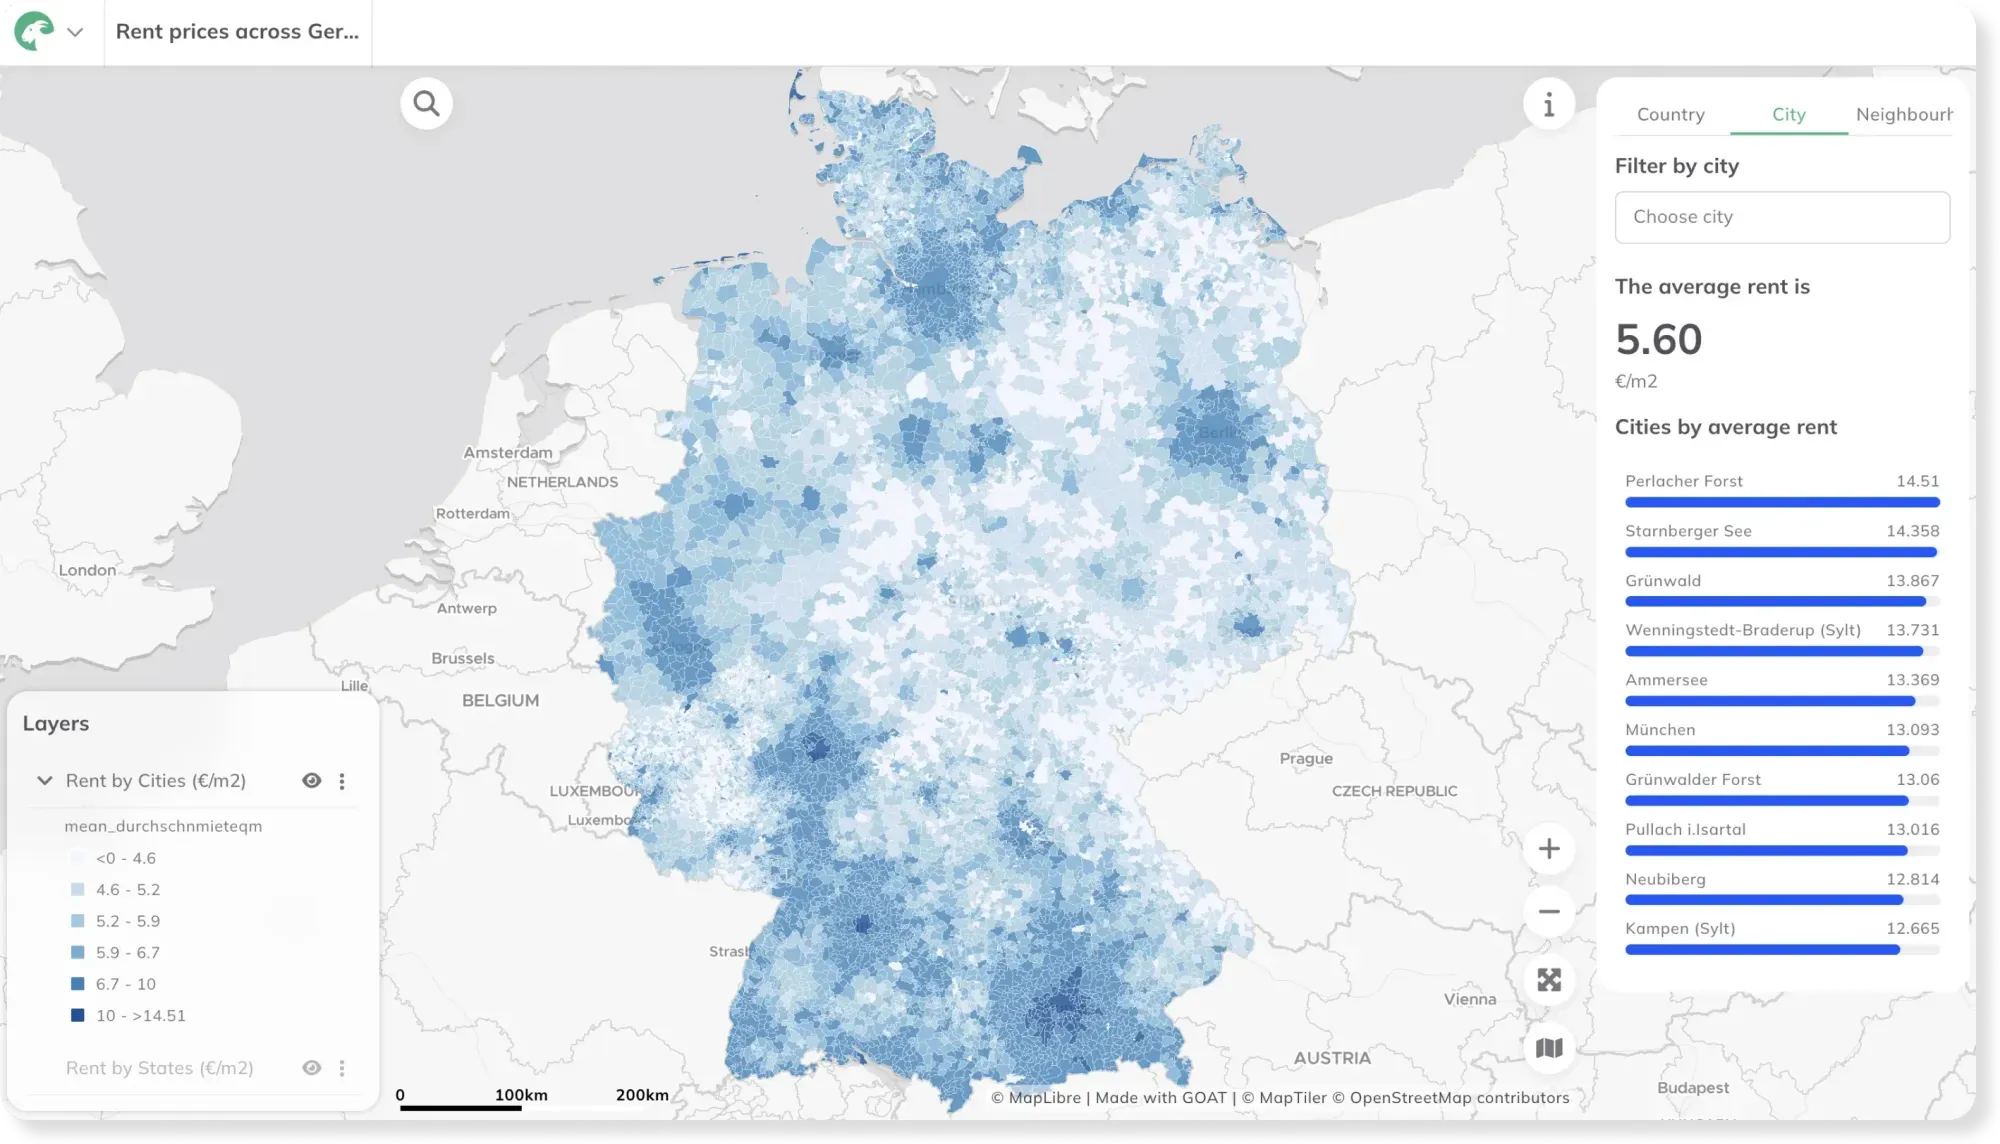
- Real Estate
- Cities & Government
Rent prices across Germany
With rising rental prices impacting cities across the world, this map visualizes net rent per m² in Germany across different administrative boundaries
See the map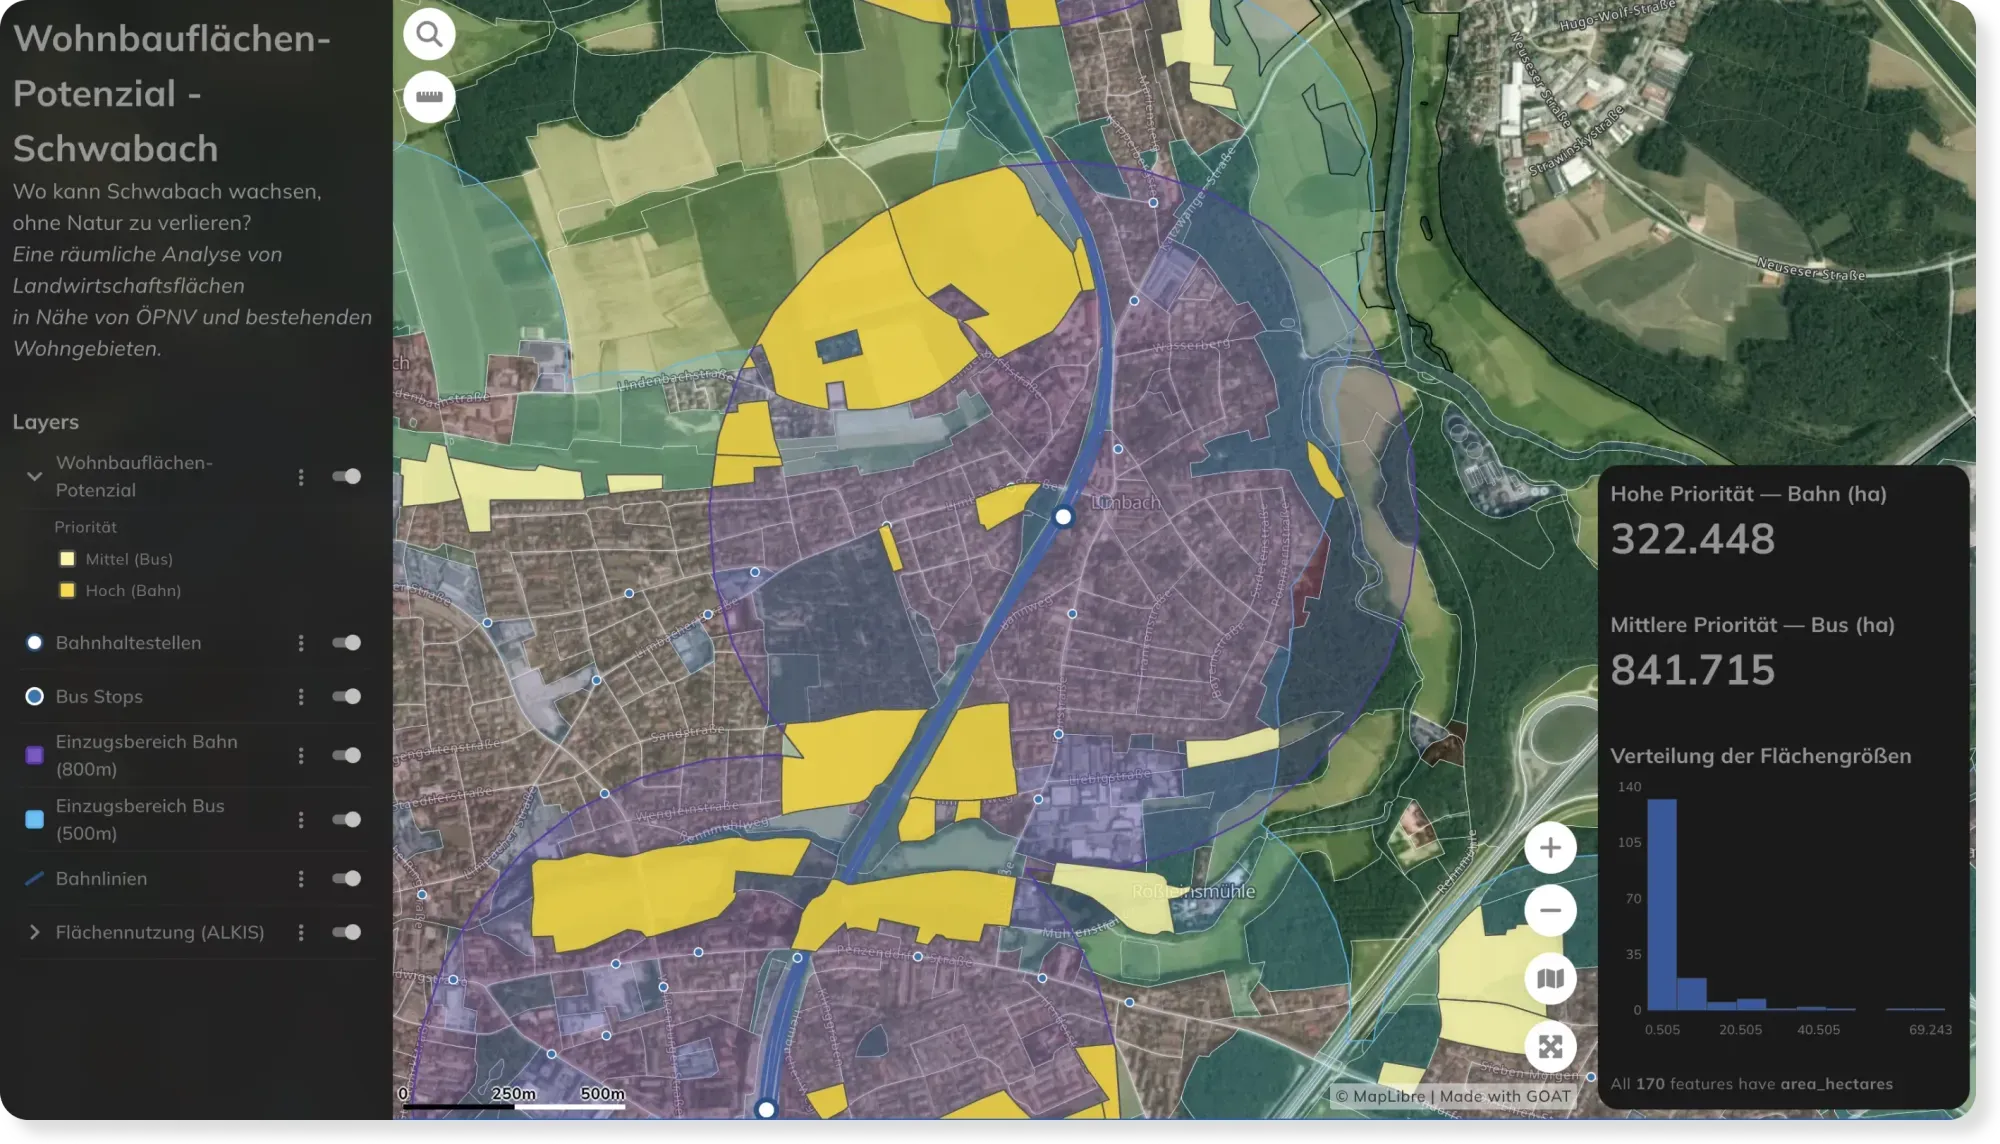
- Cities & Government
- Real Estate
Land Use & Development Potential in Schwabach
See how land is used across Schwabach — and where there's room to grow. An open land-use map for planners, developers, and citizens.
See the map
Ready to make sense of your data?
Join planners, organizations and cities using GOAT to make better decisions, faster. No GIS expertise needed.